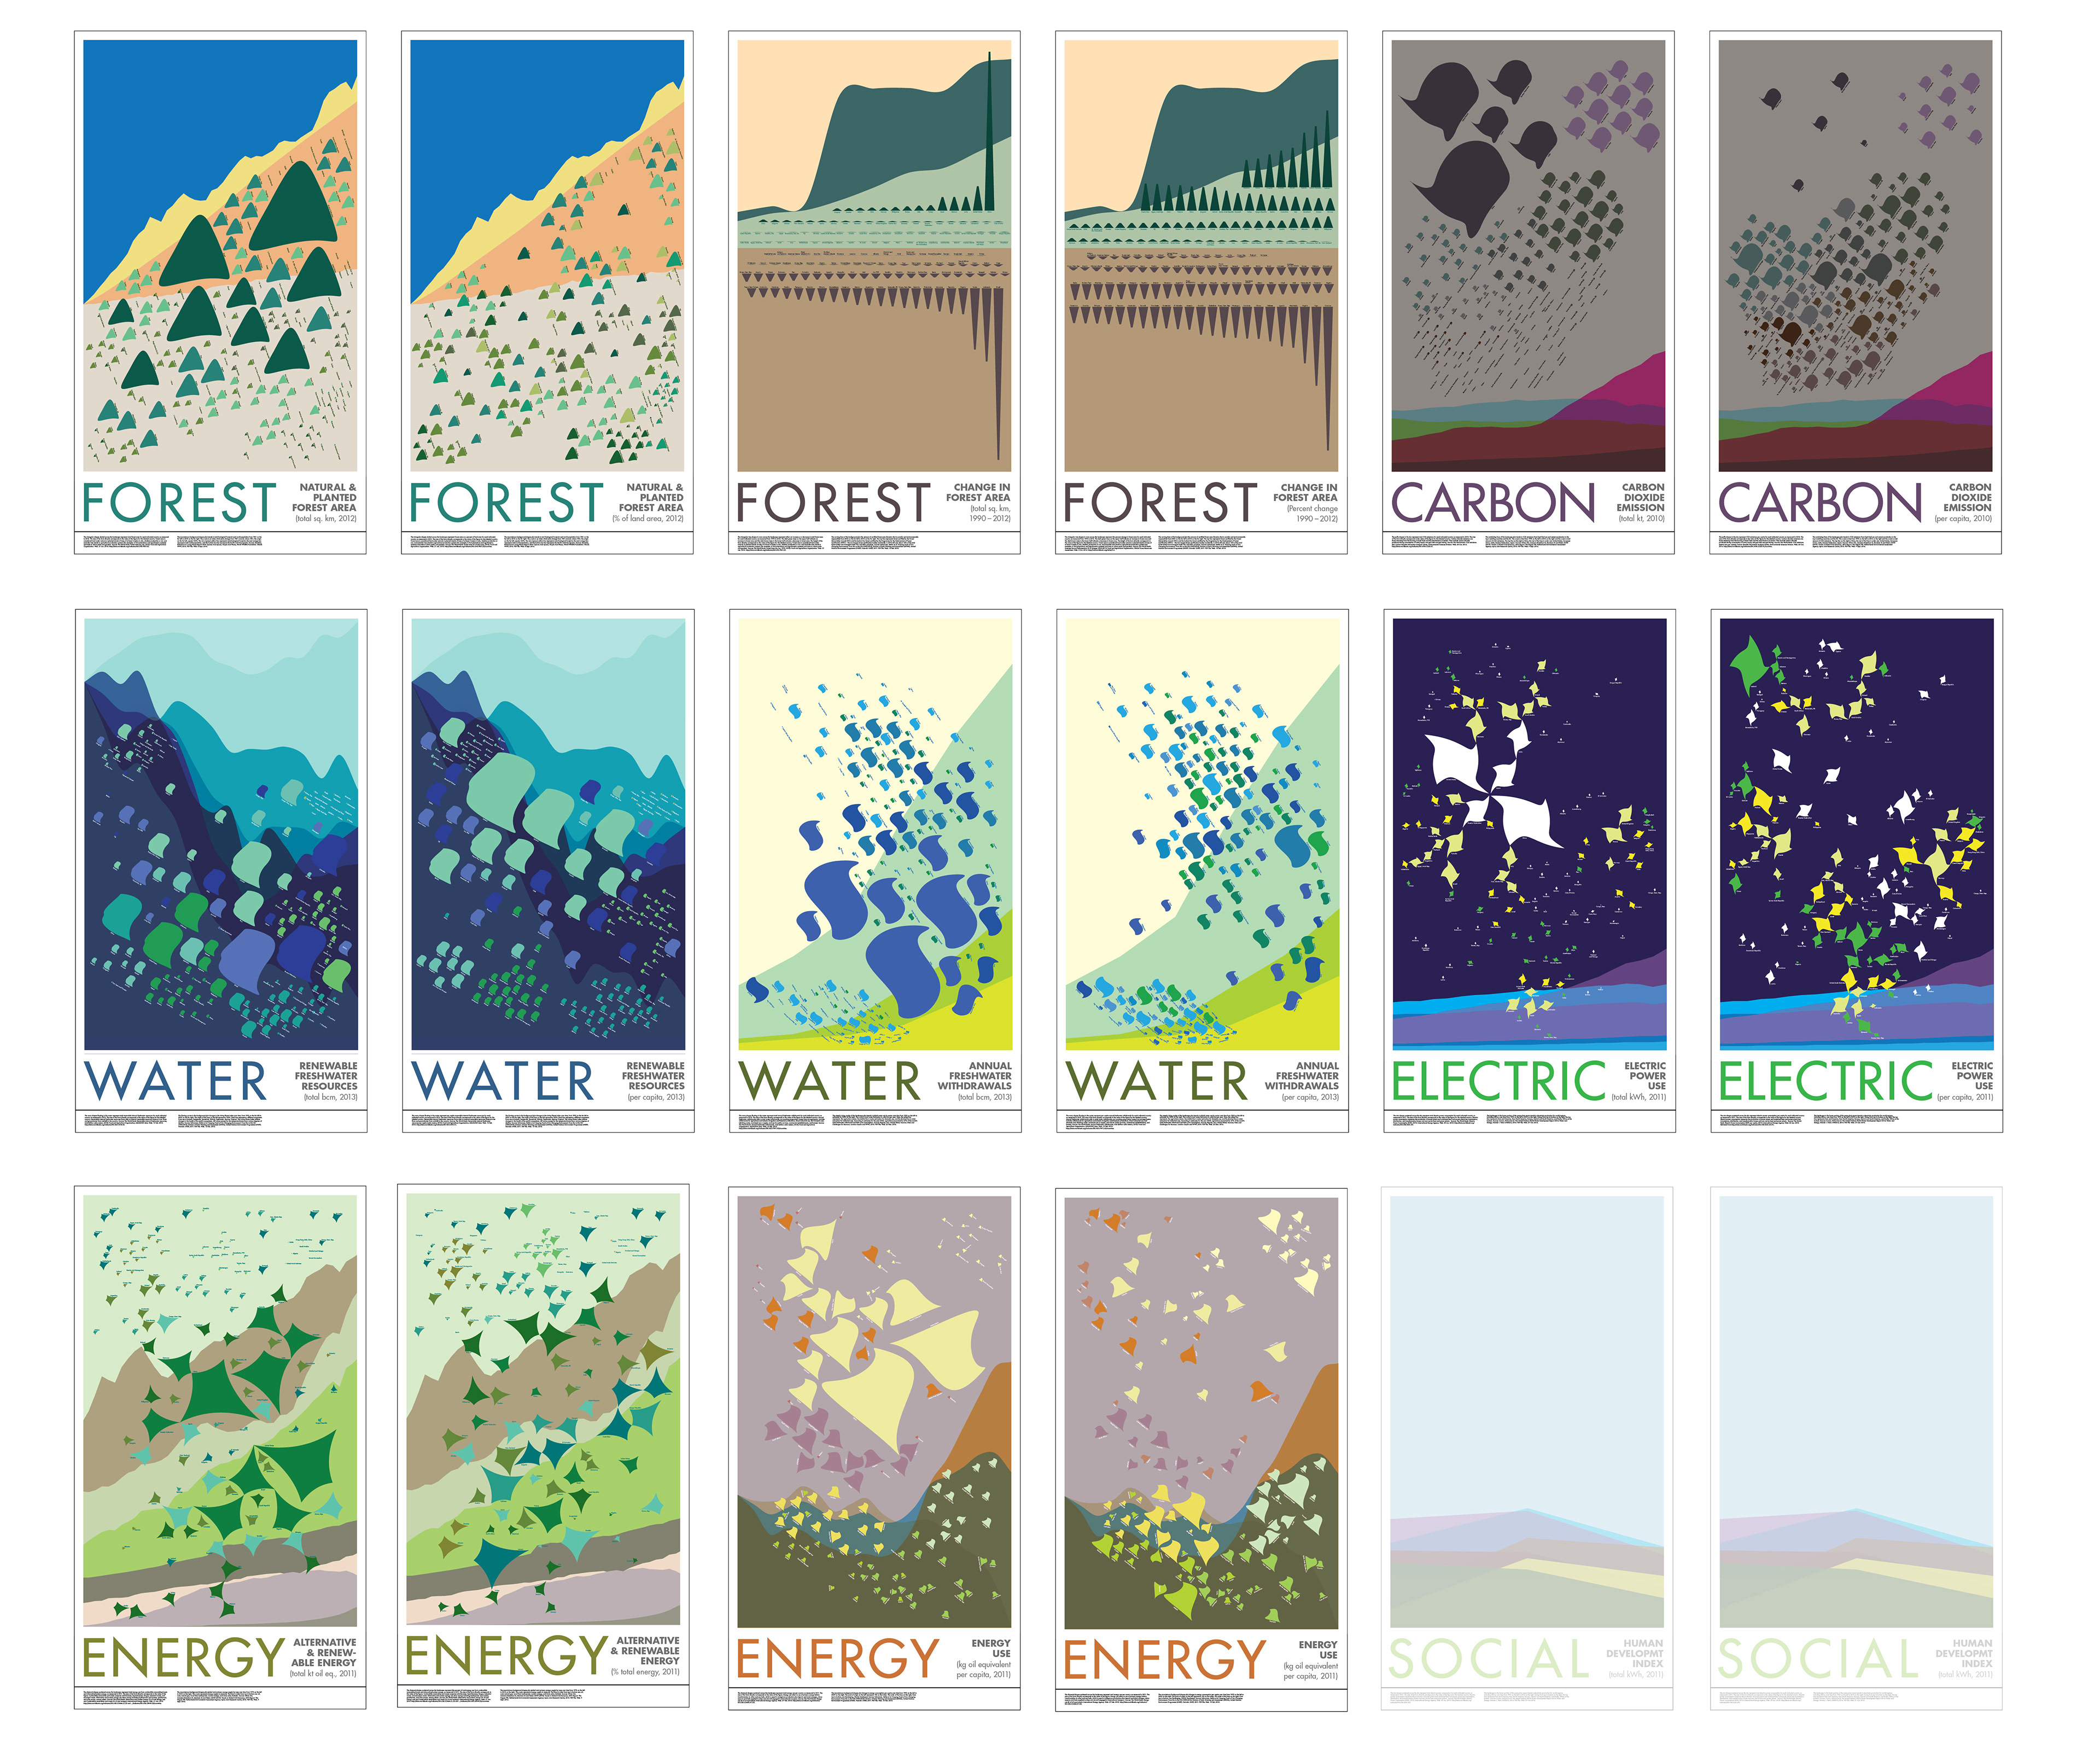
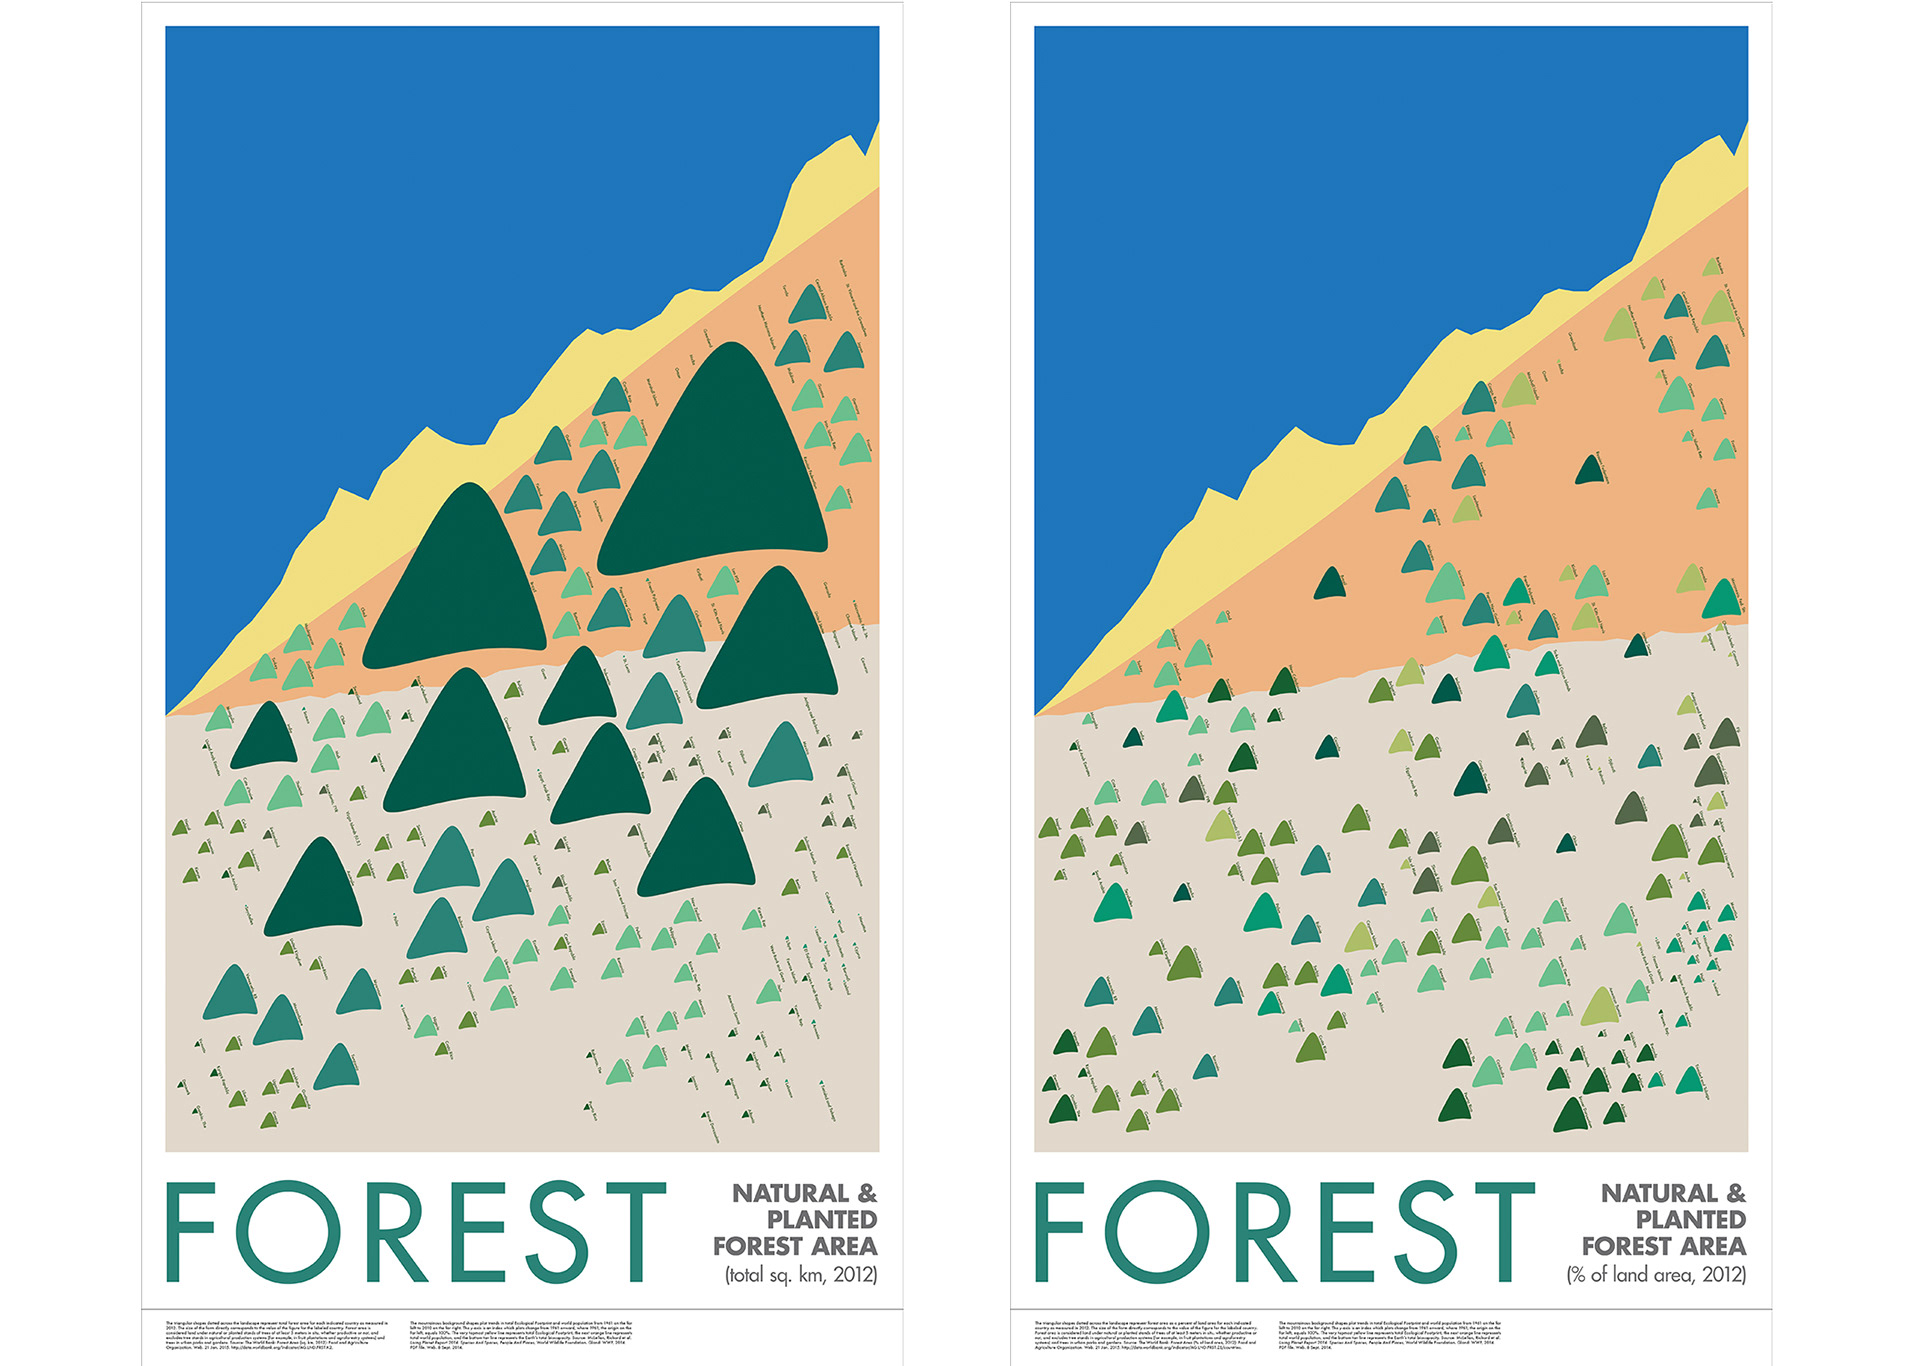
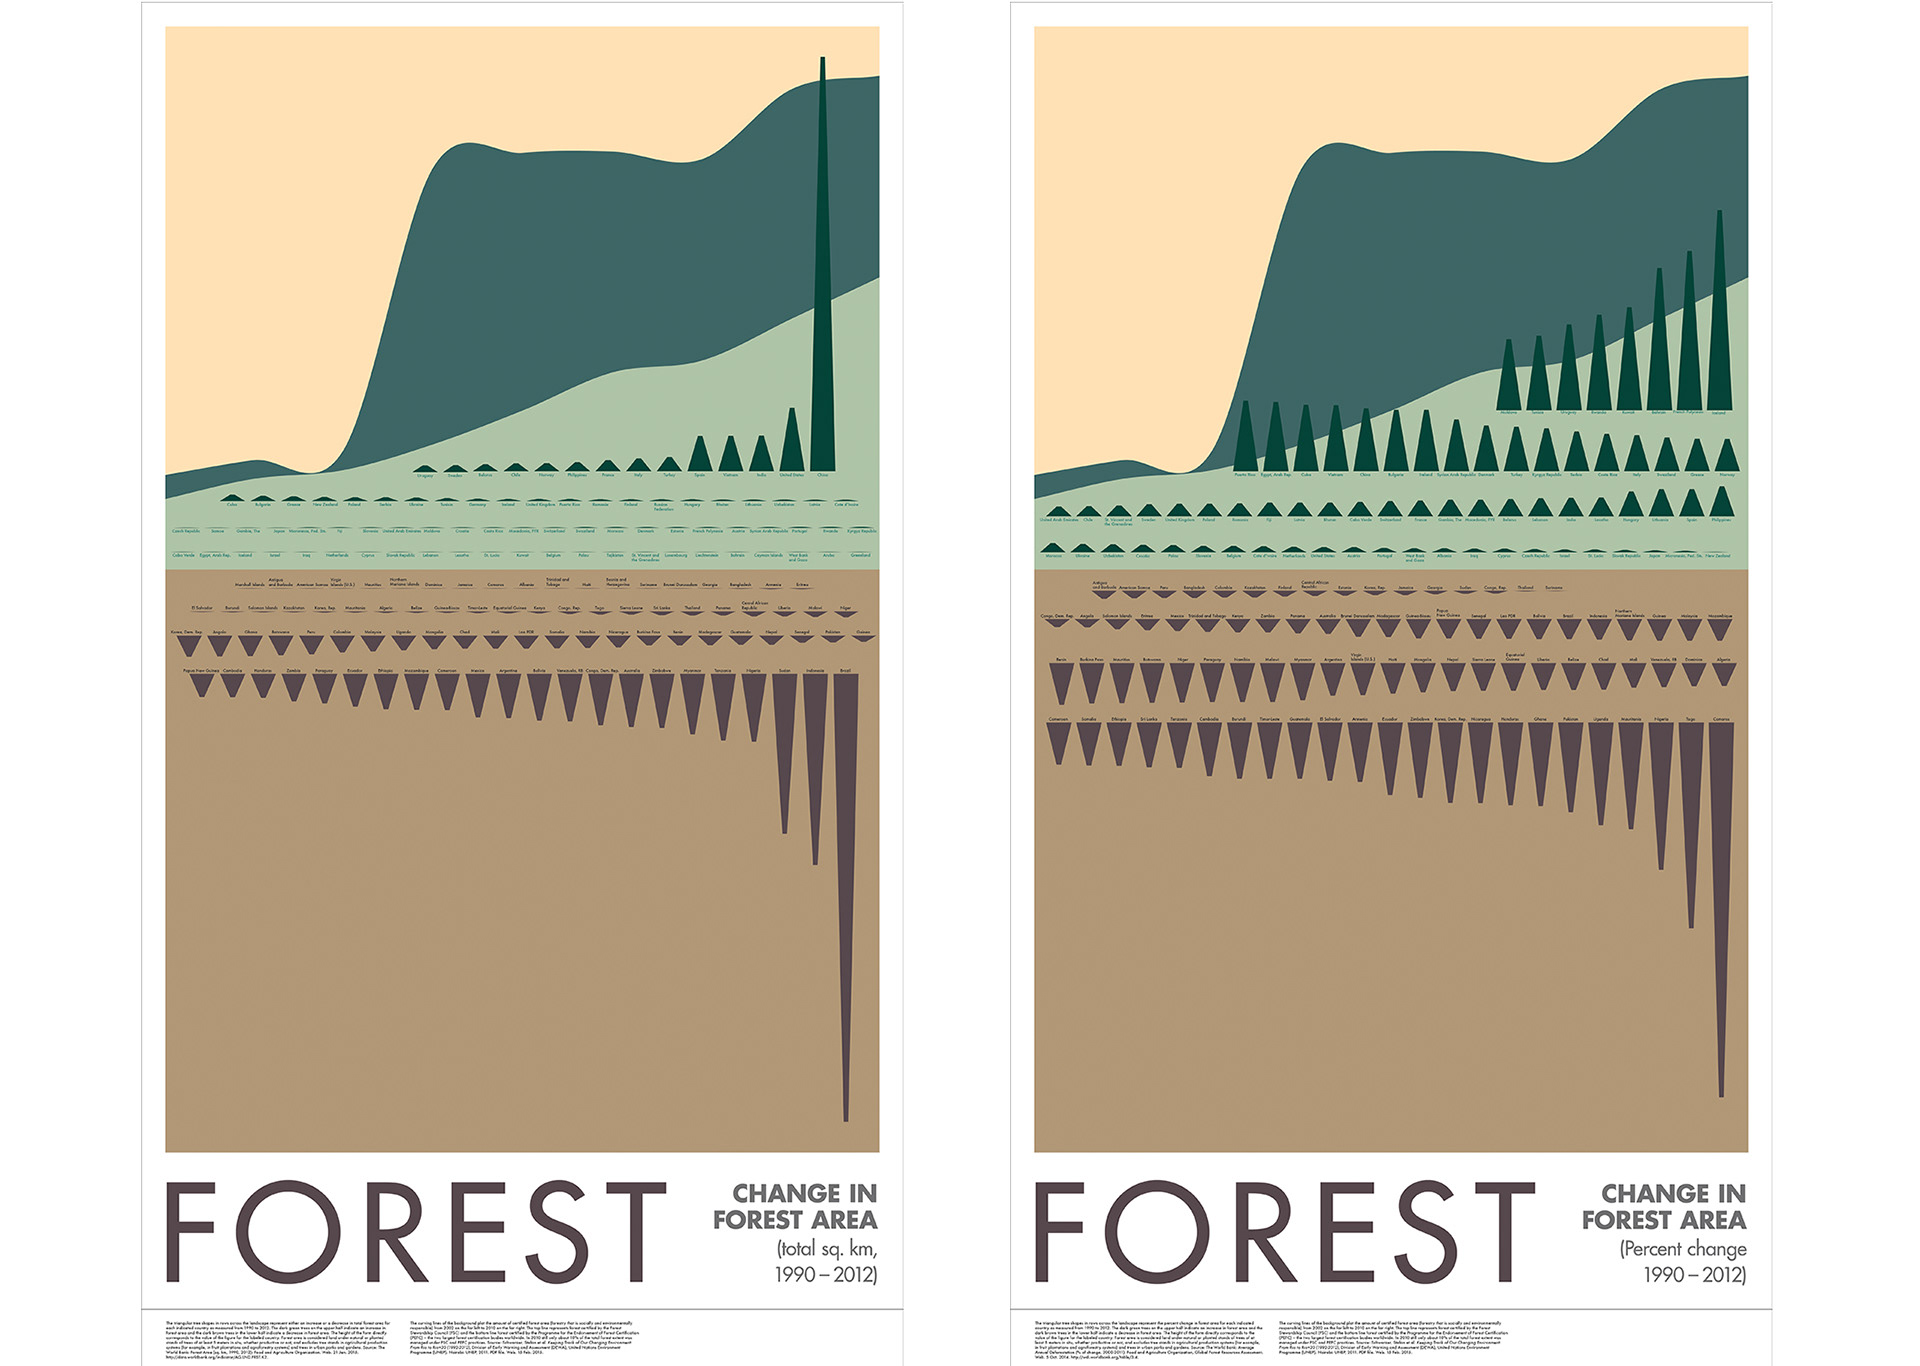
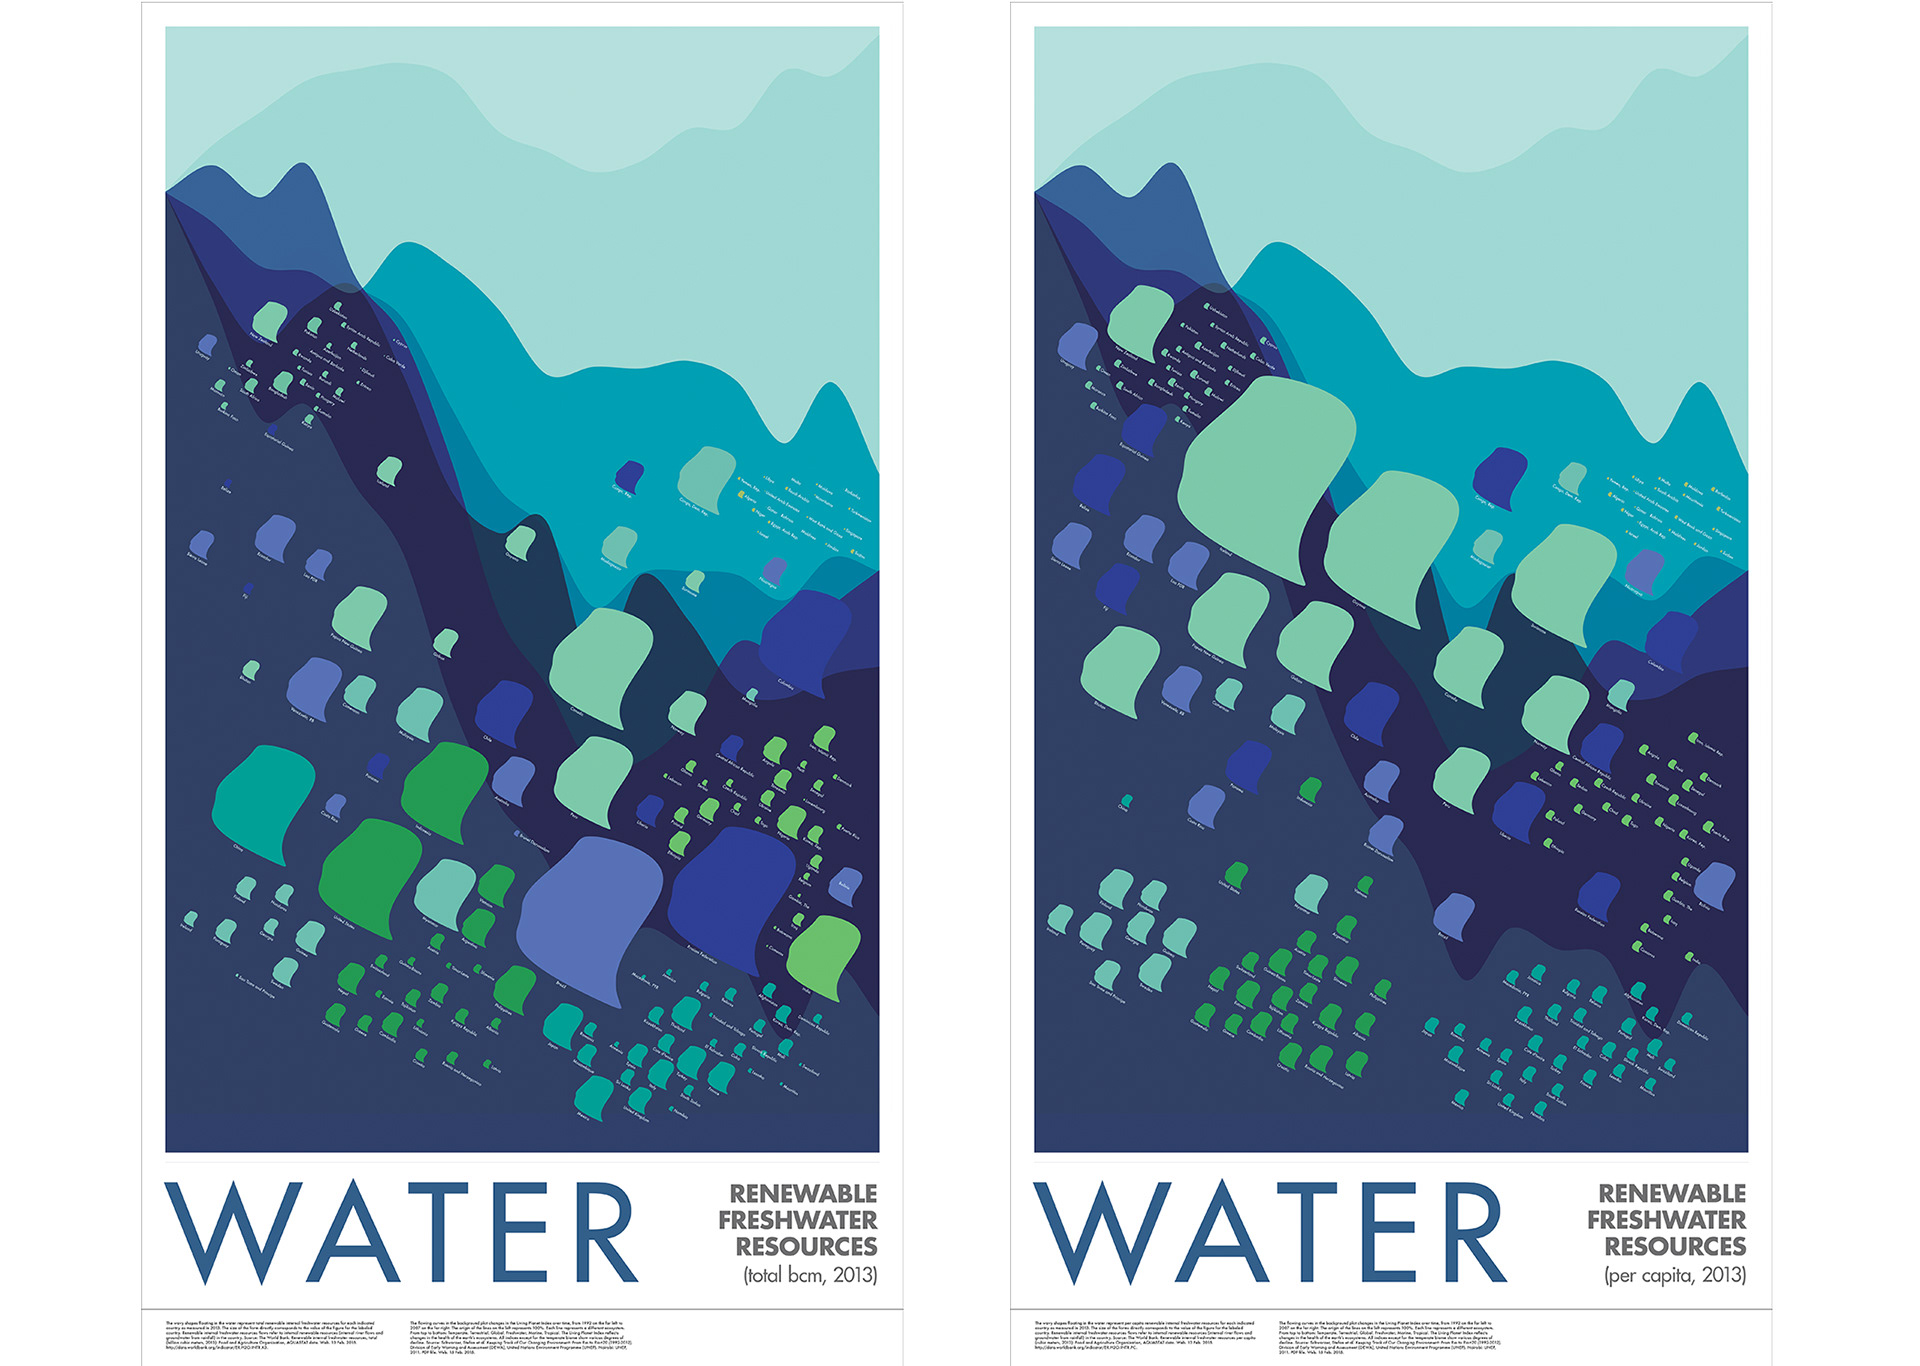
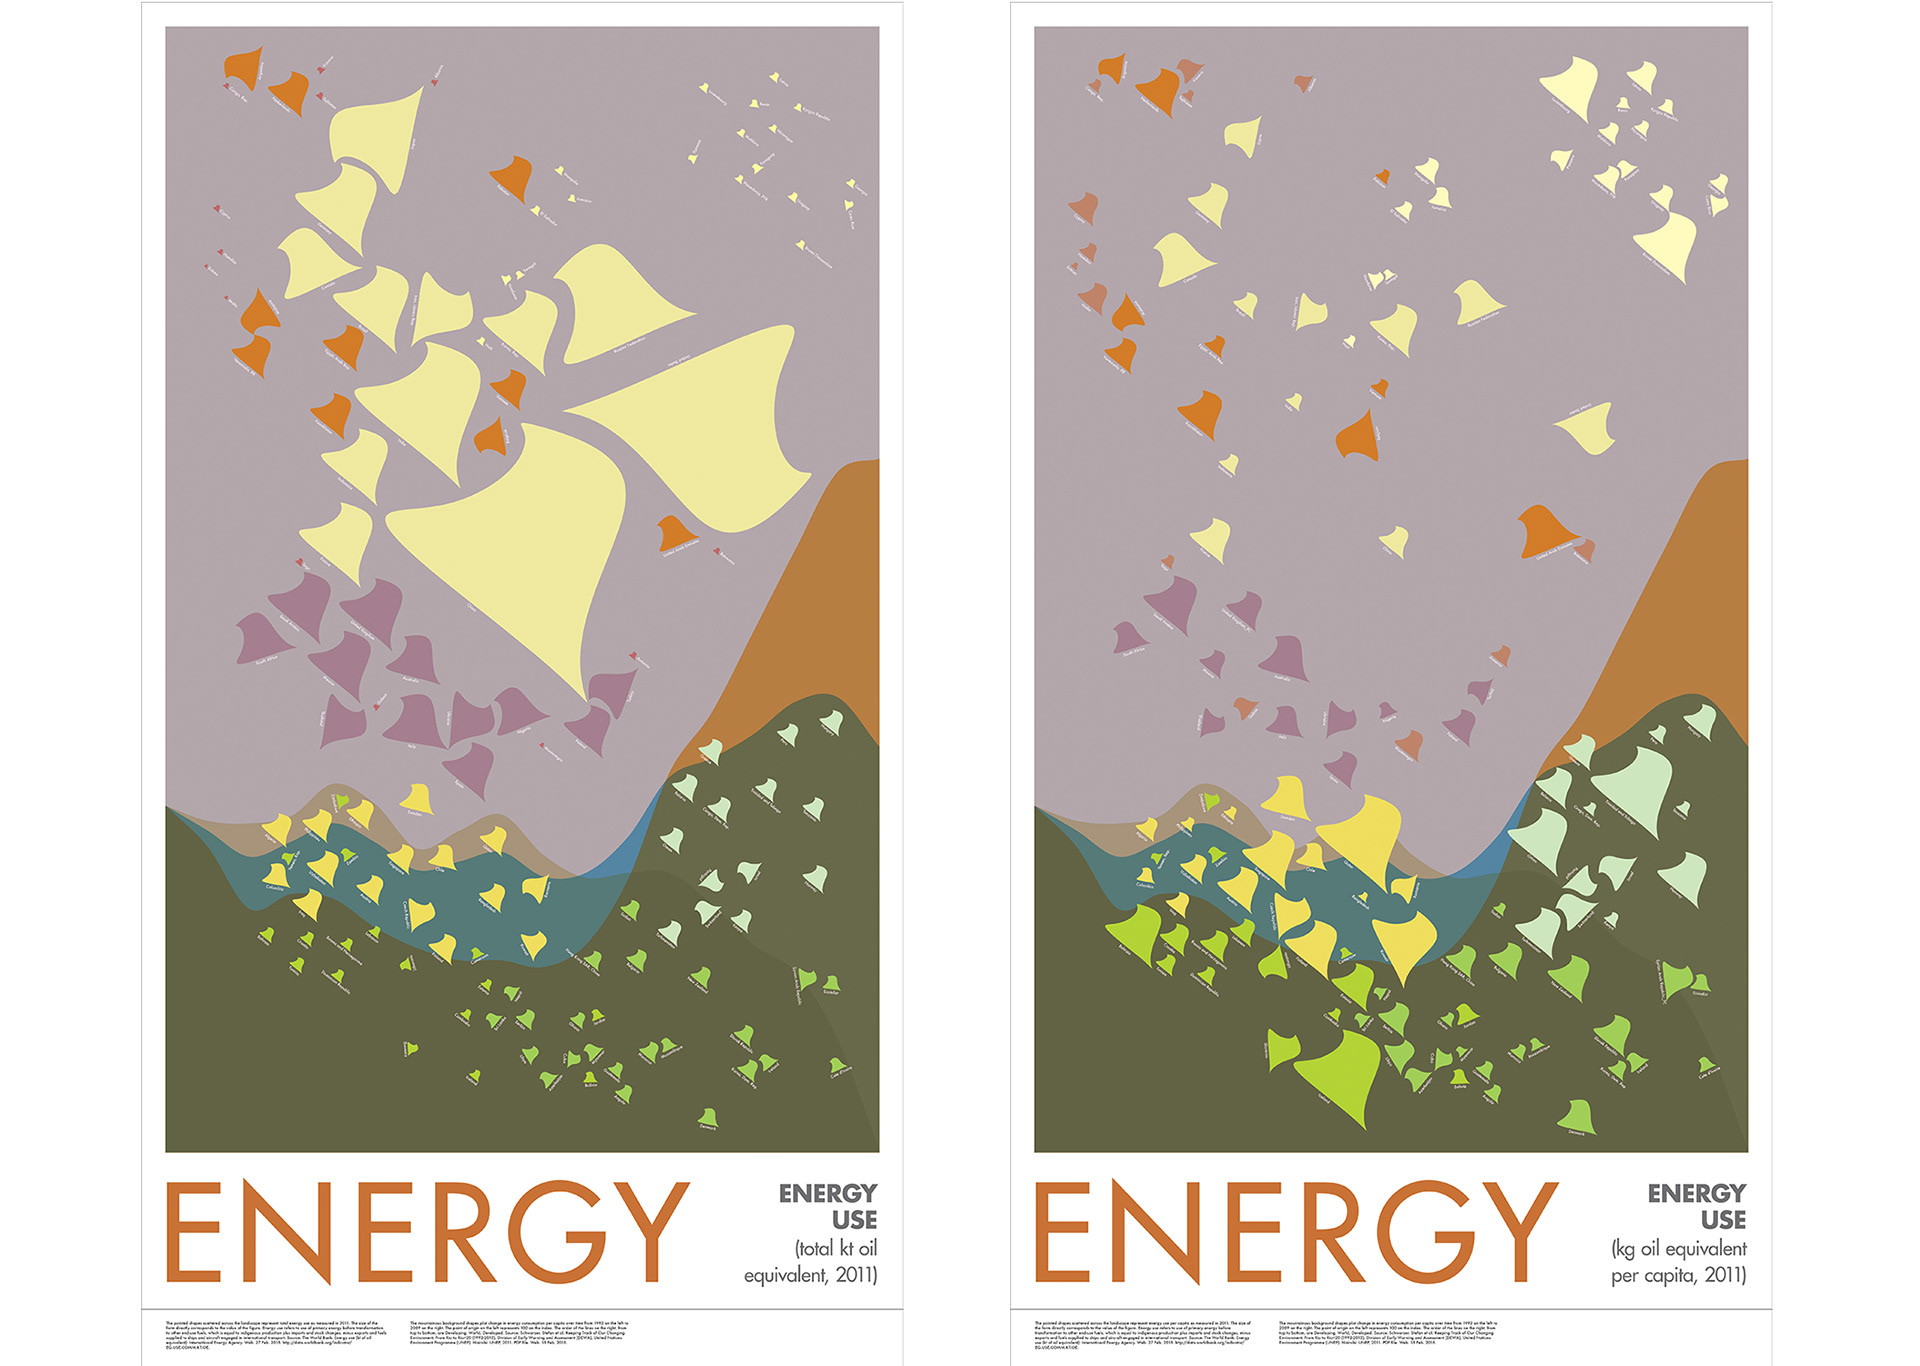
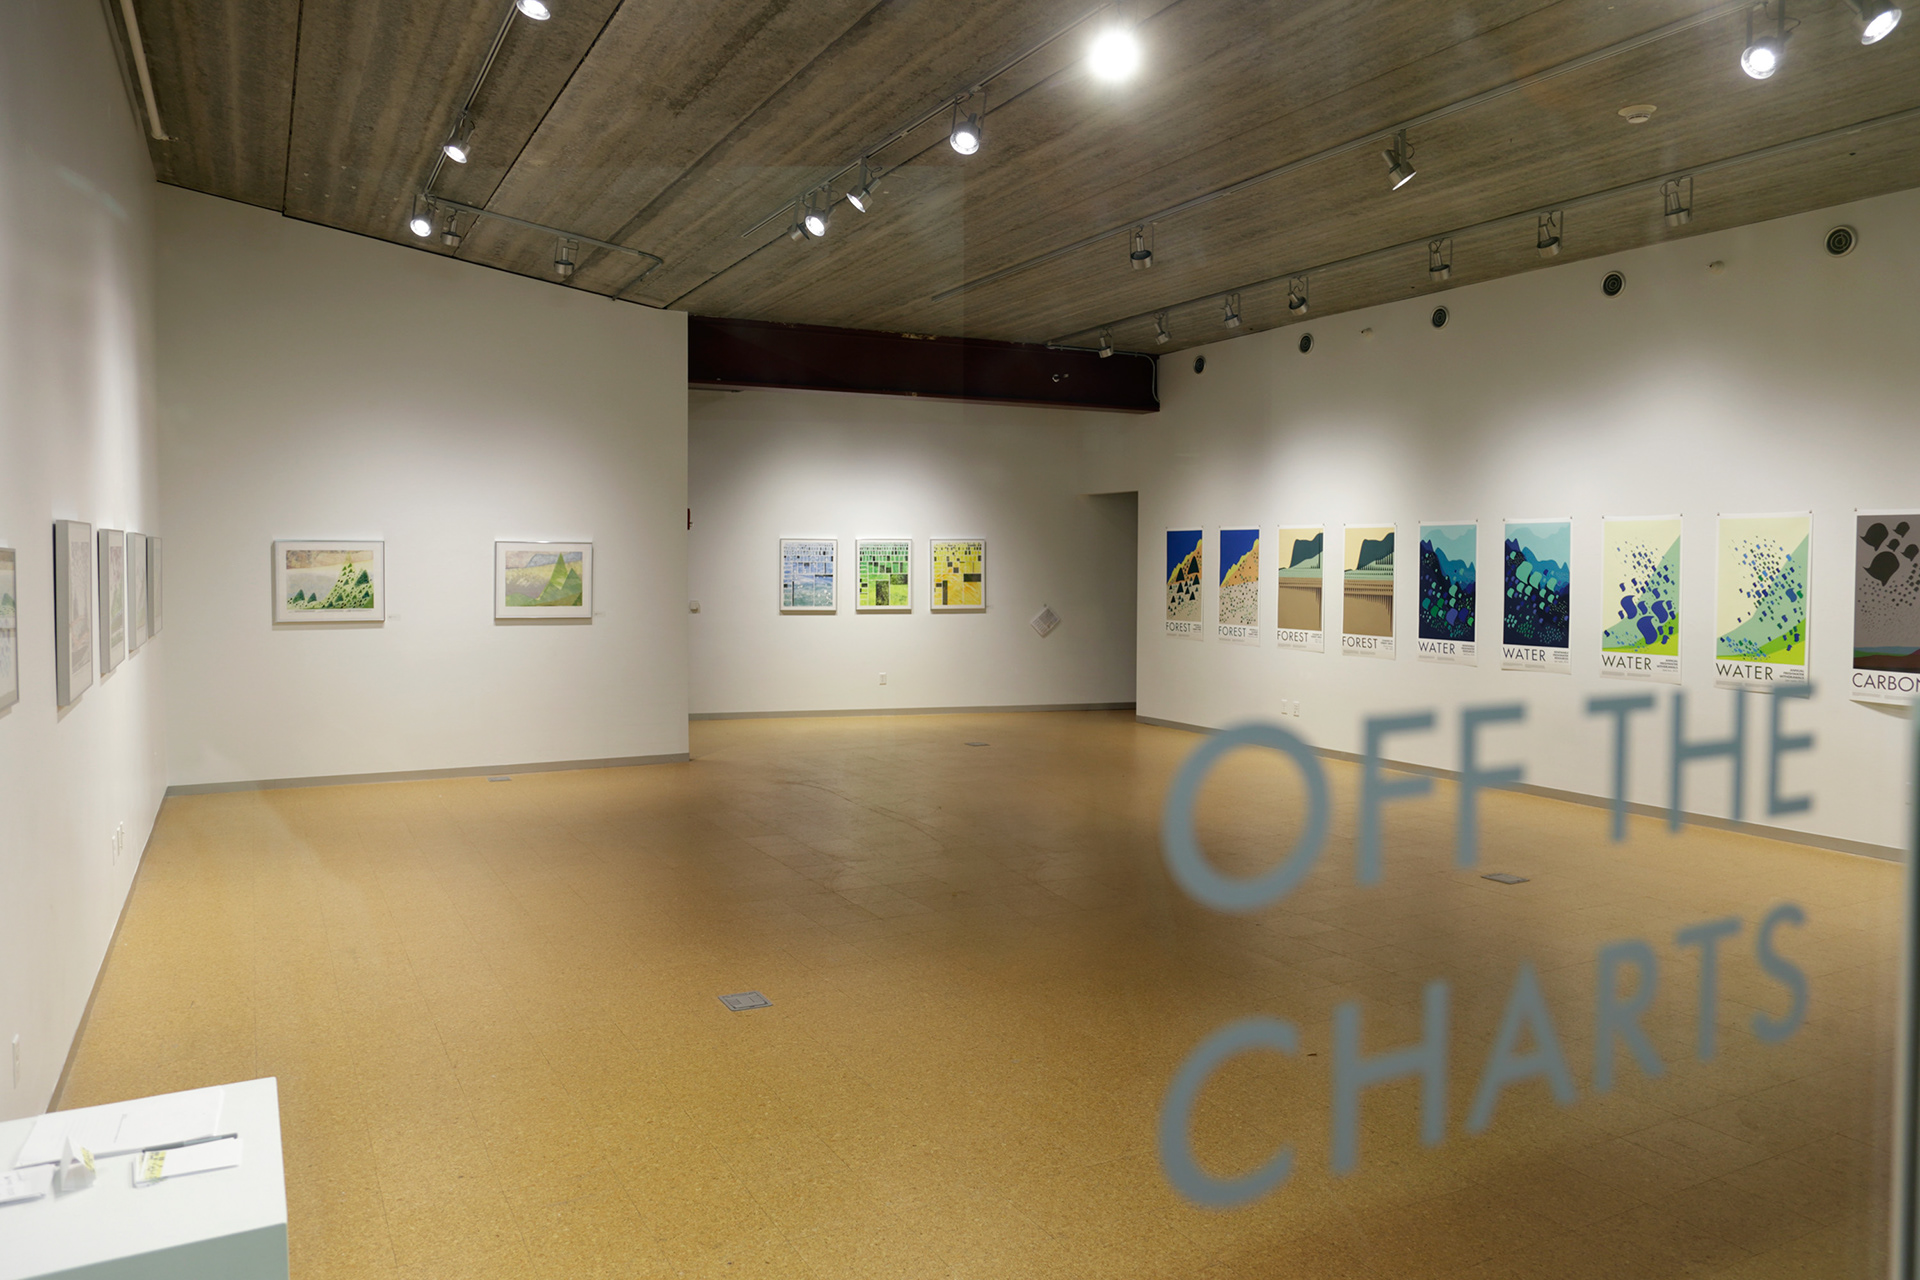
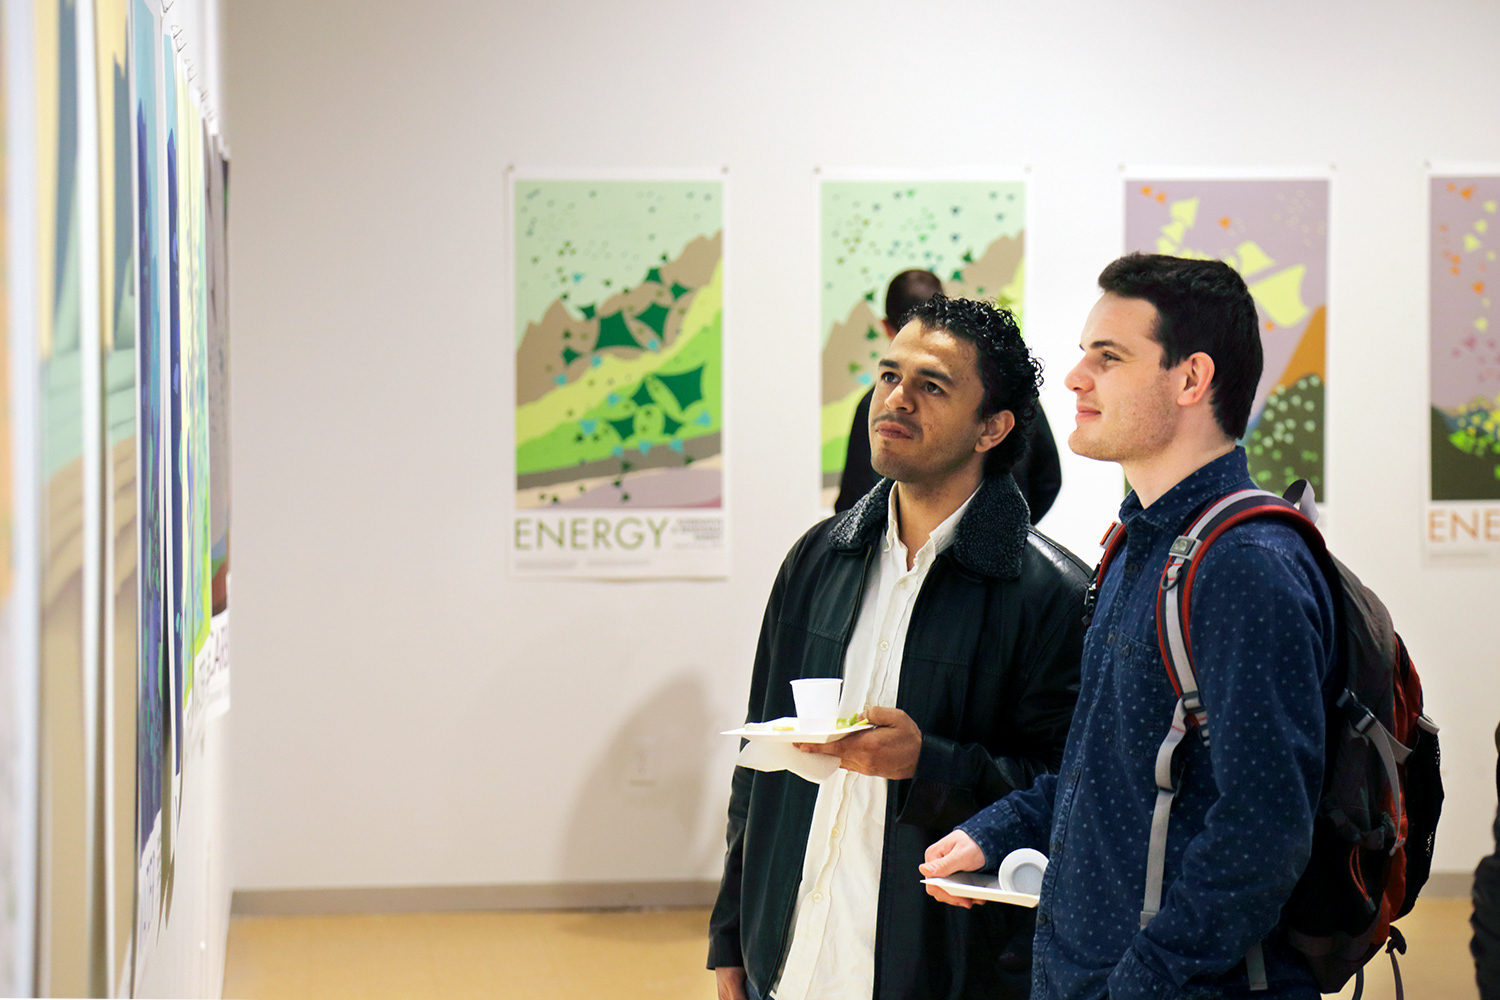
Digital graphic illustrations, printed on an Epson inkjet printer on enhanced matte card stock paper.
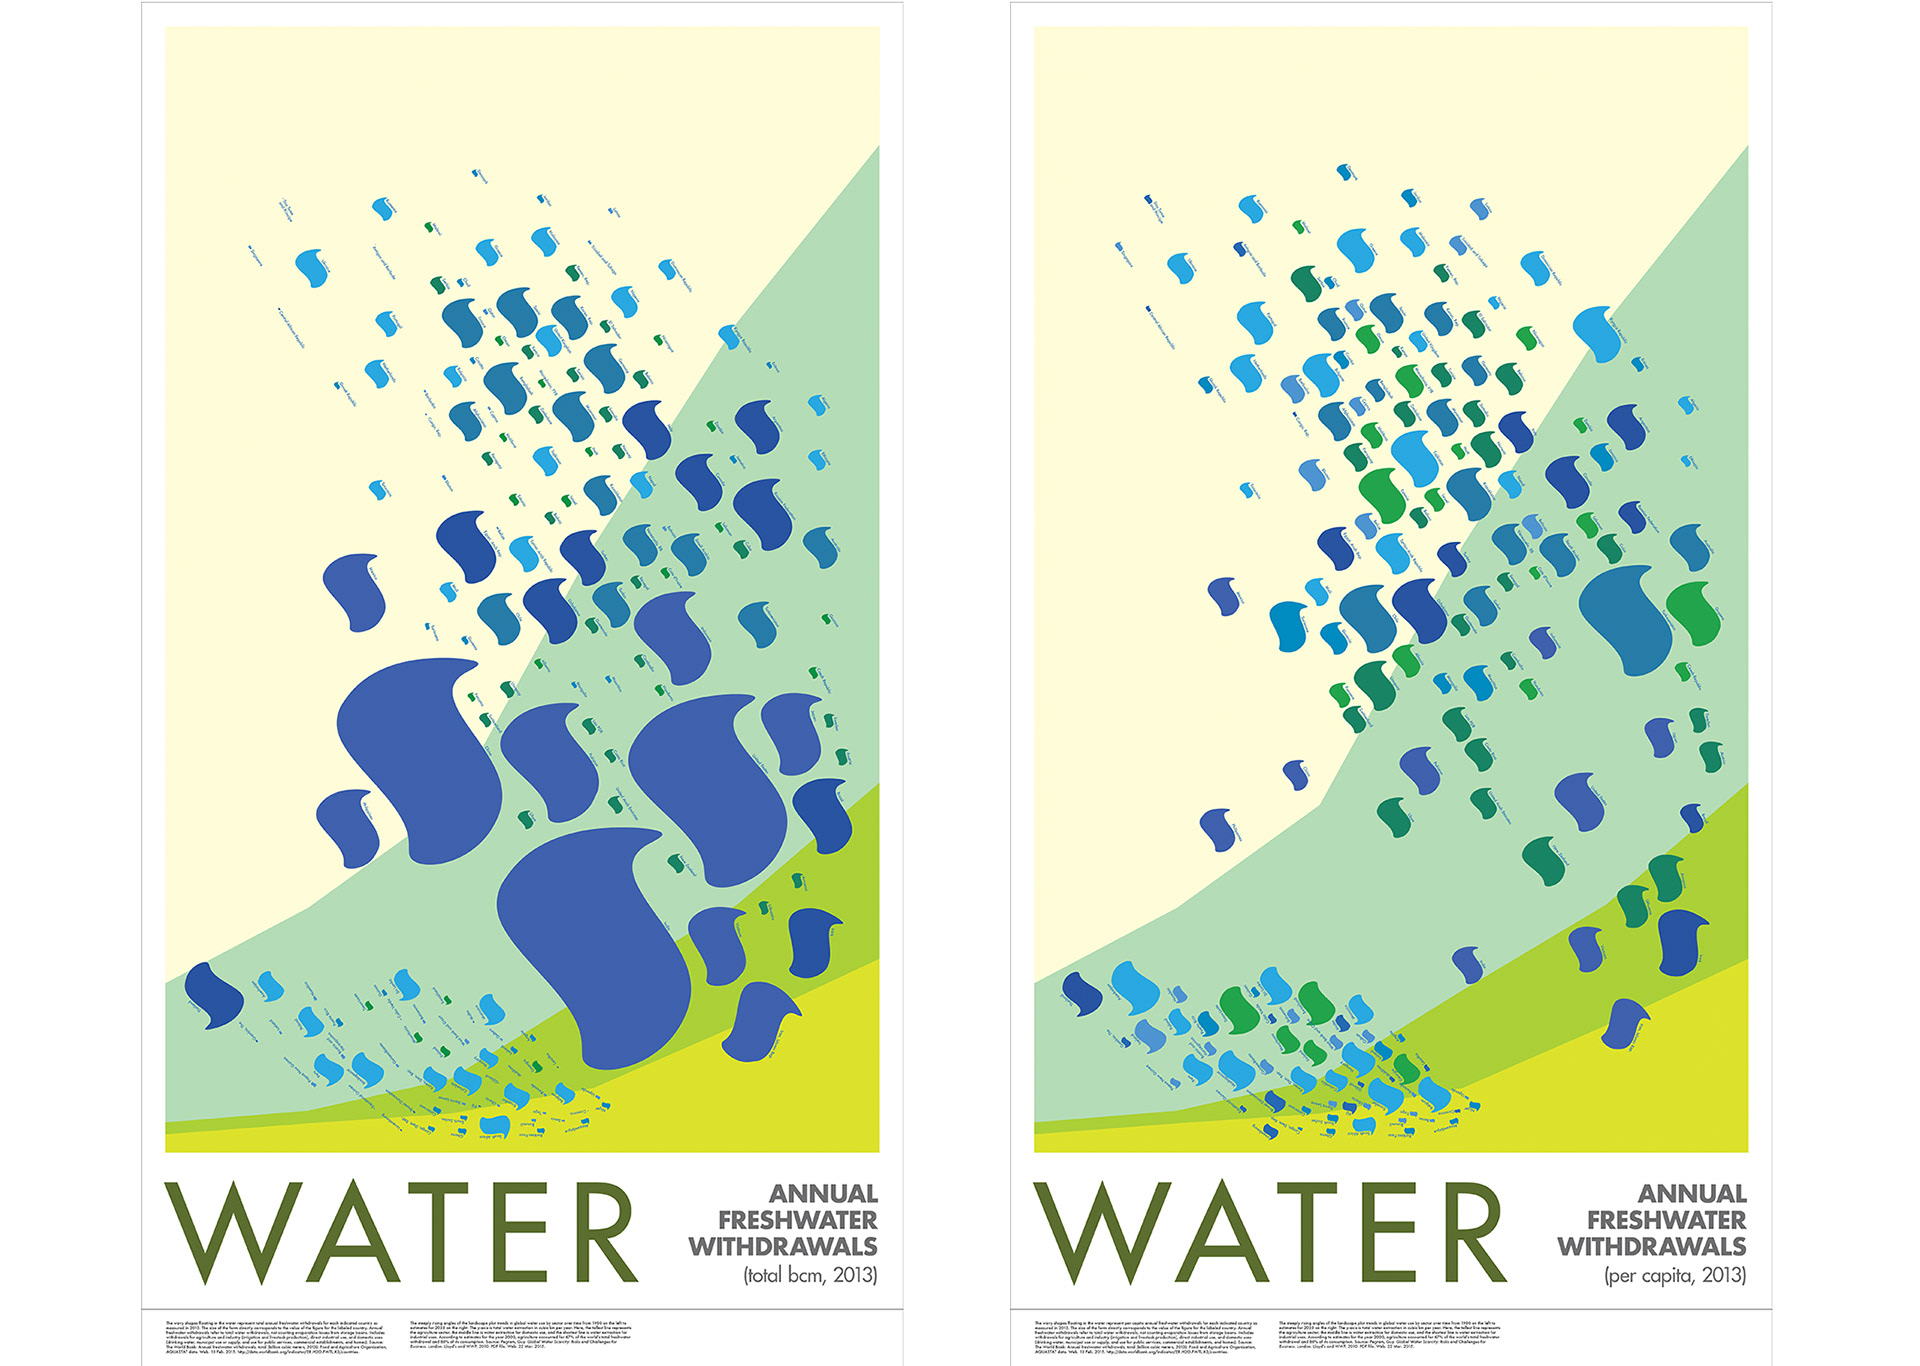
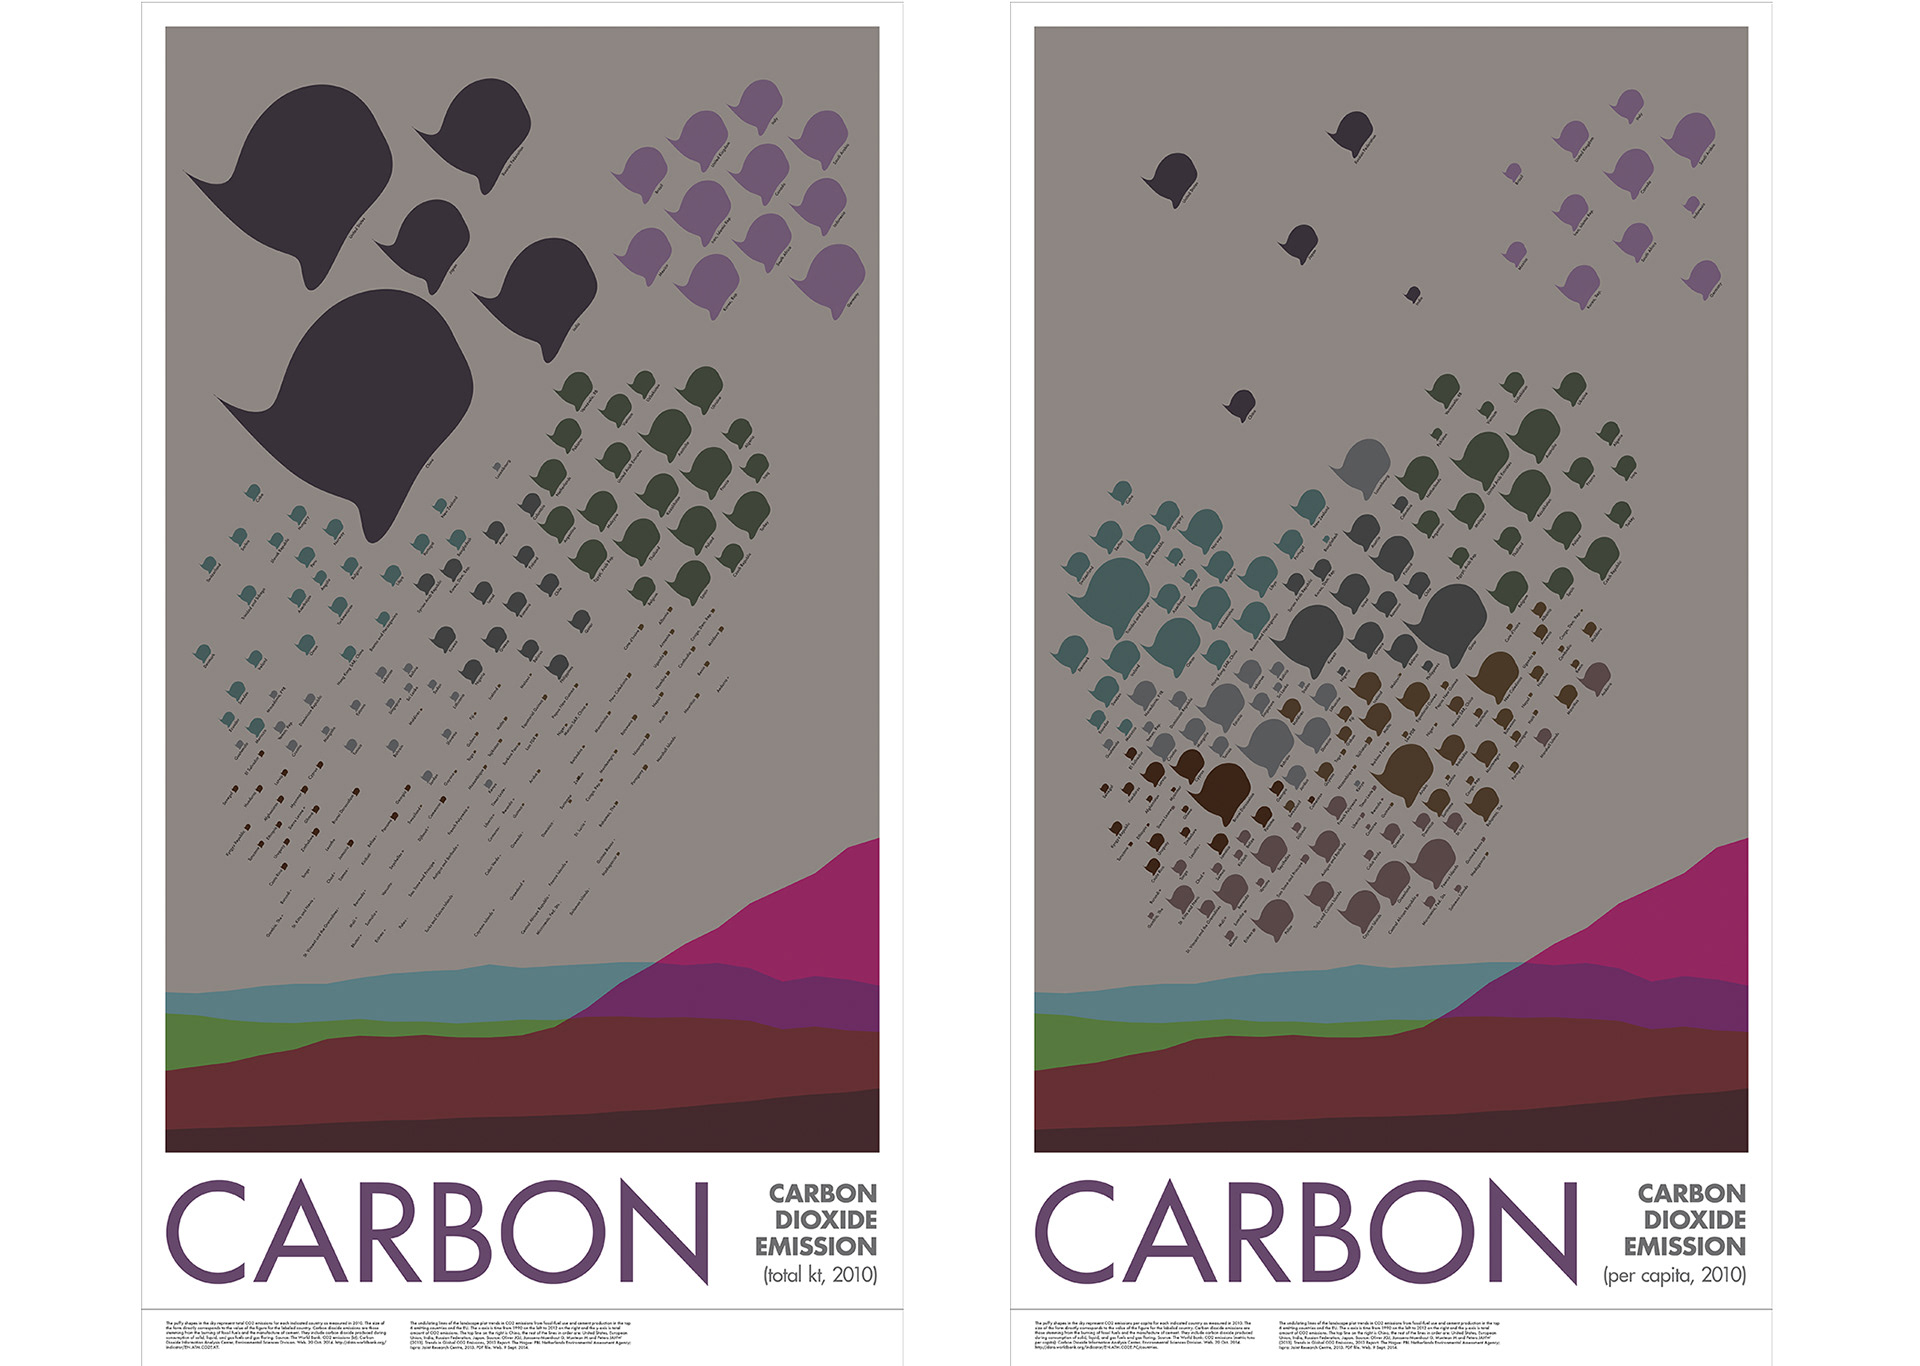
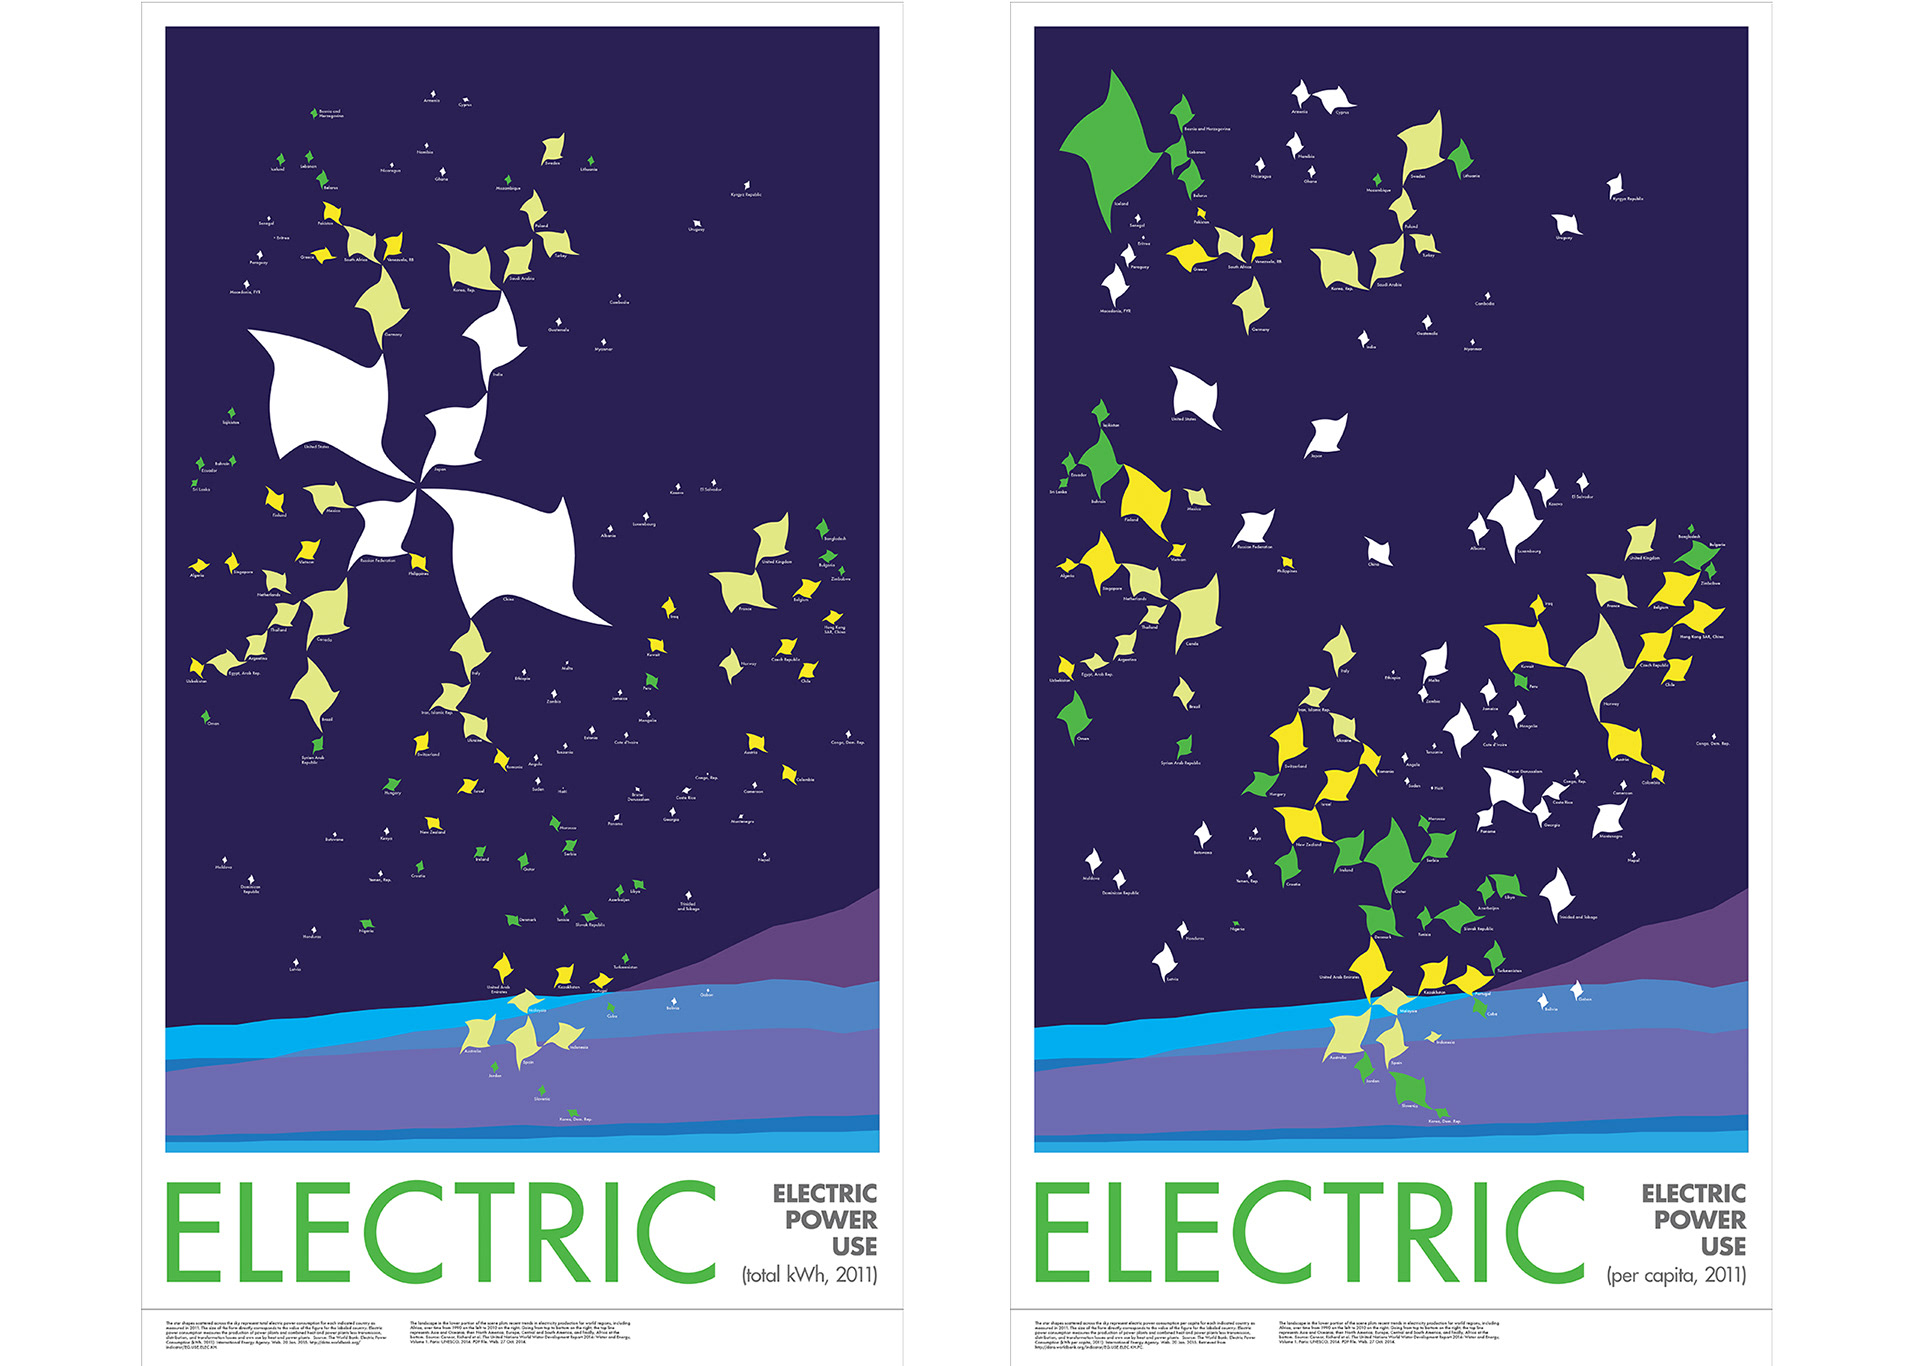
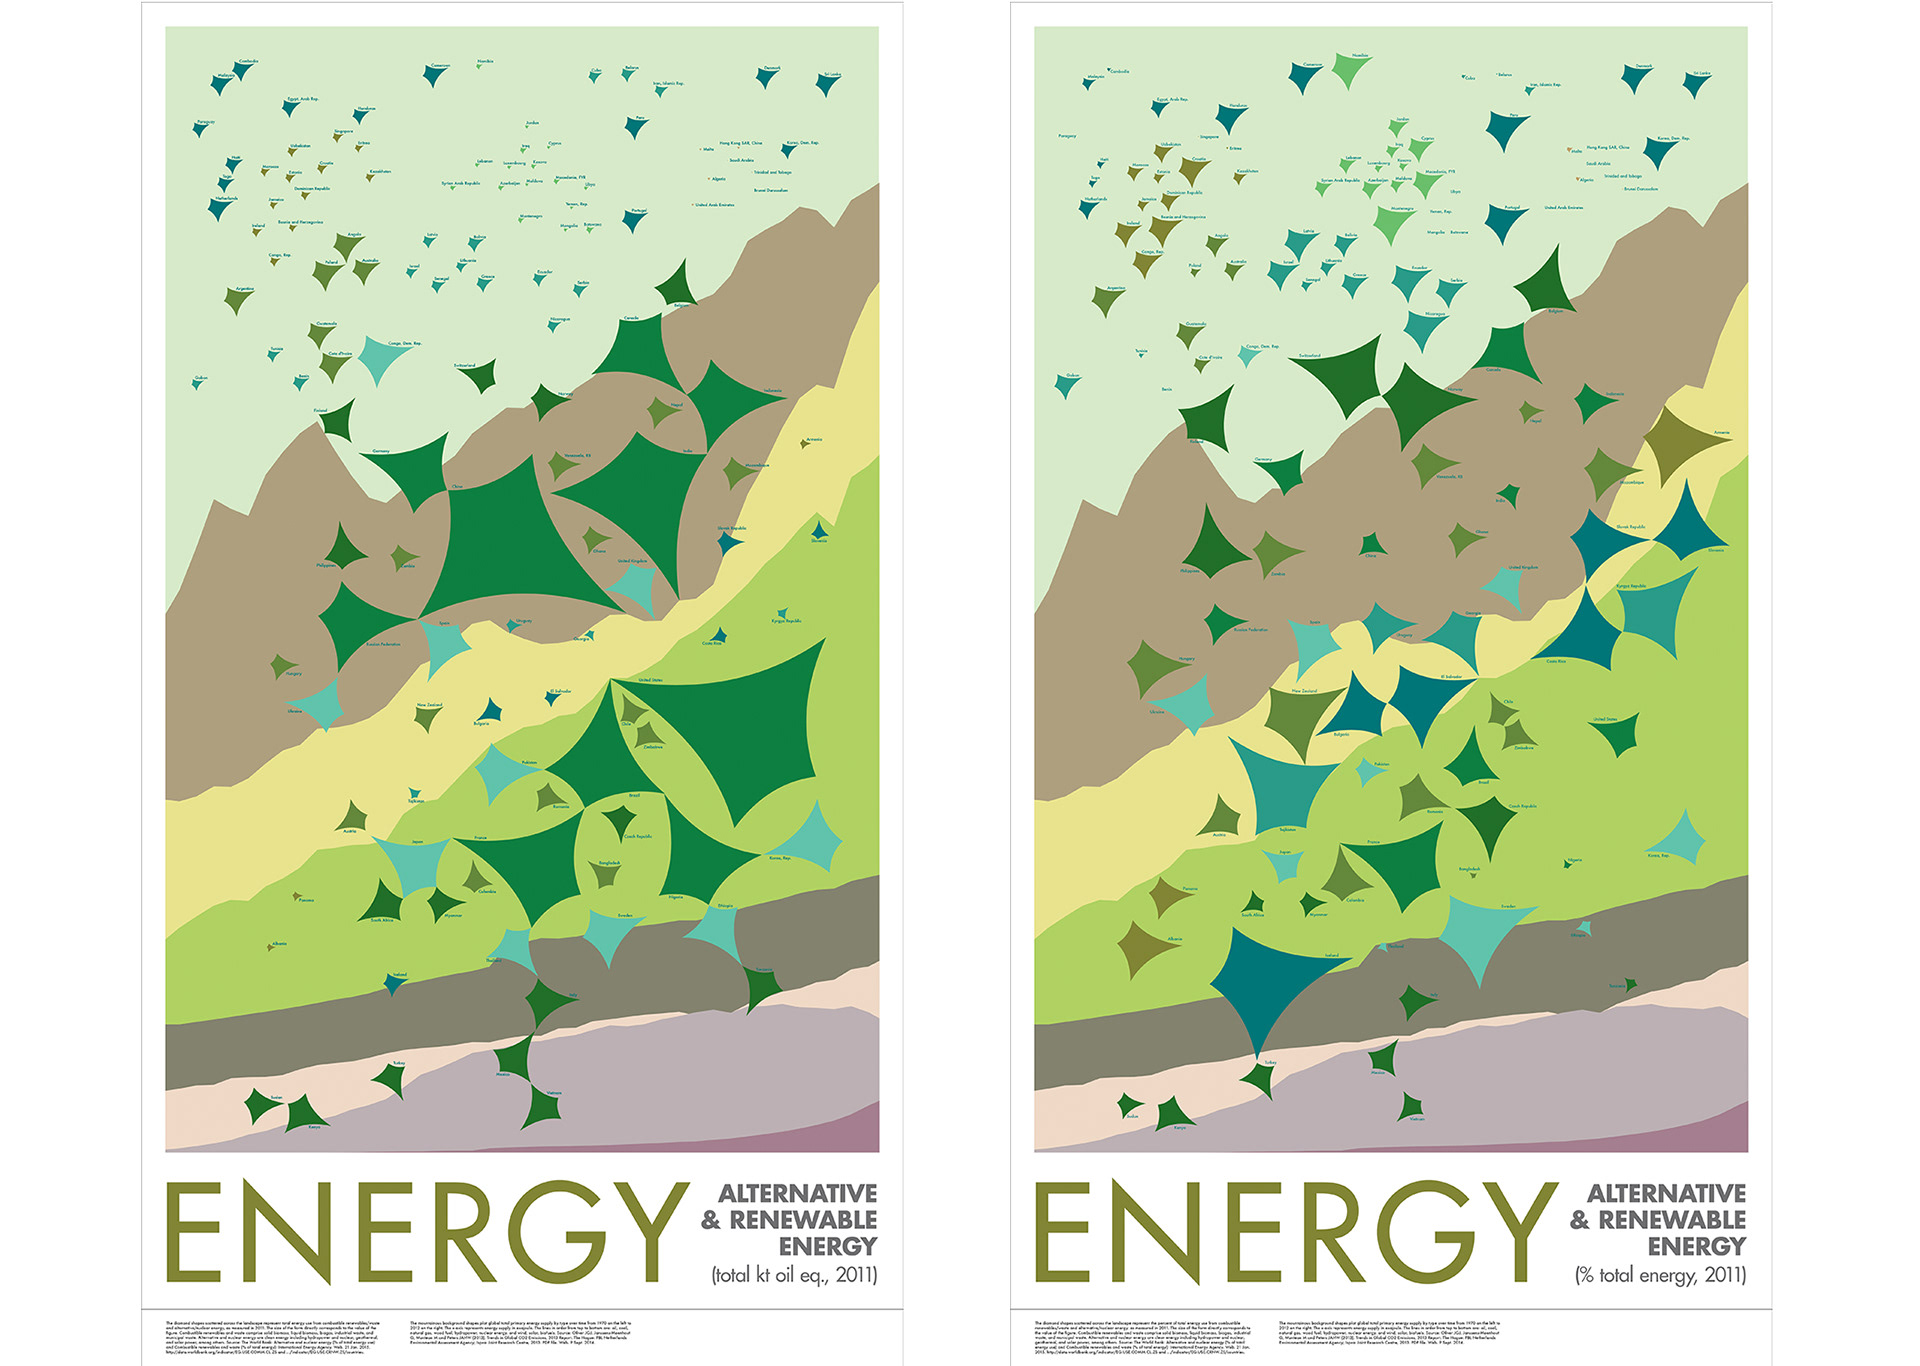
I worked with data indicators measuring sustainability, environmental deprivations, and multidimensional poverty in order to illustrate the link between sustainability and human development. Inspired by the 2014 Human Development Report "Sustaining Human Progress".
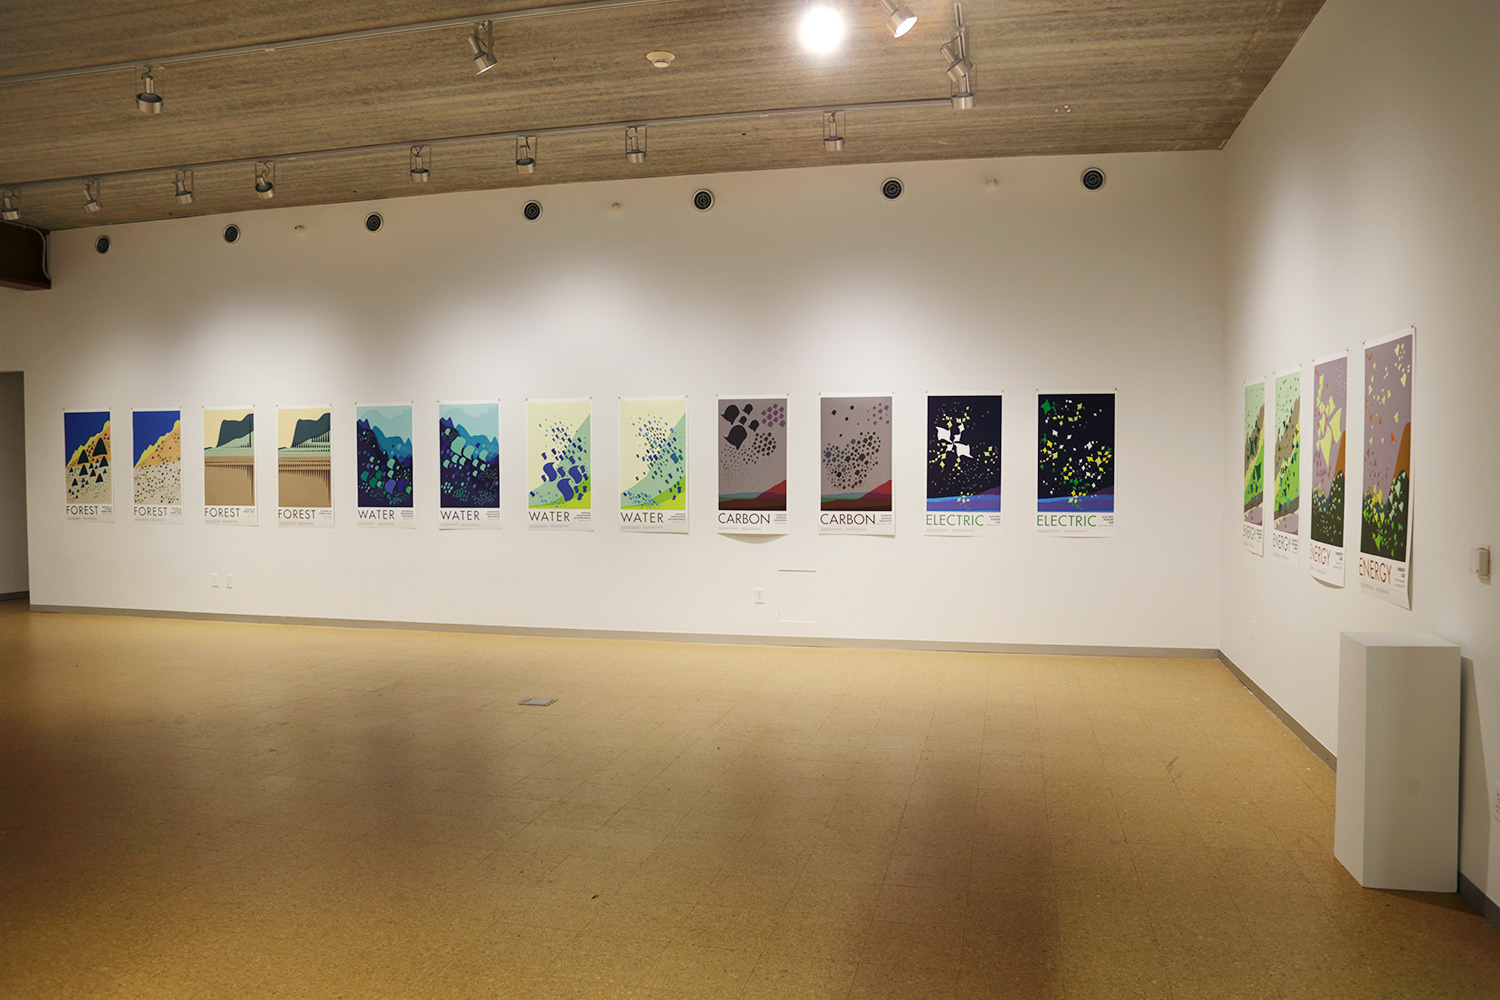
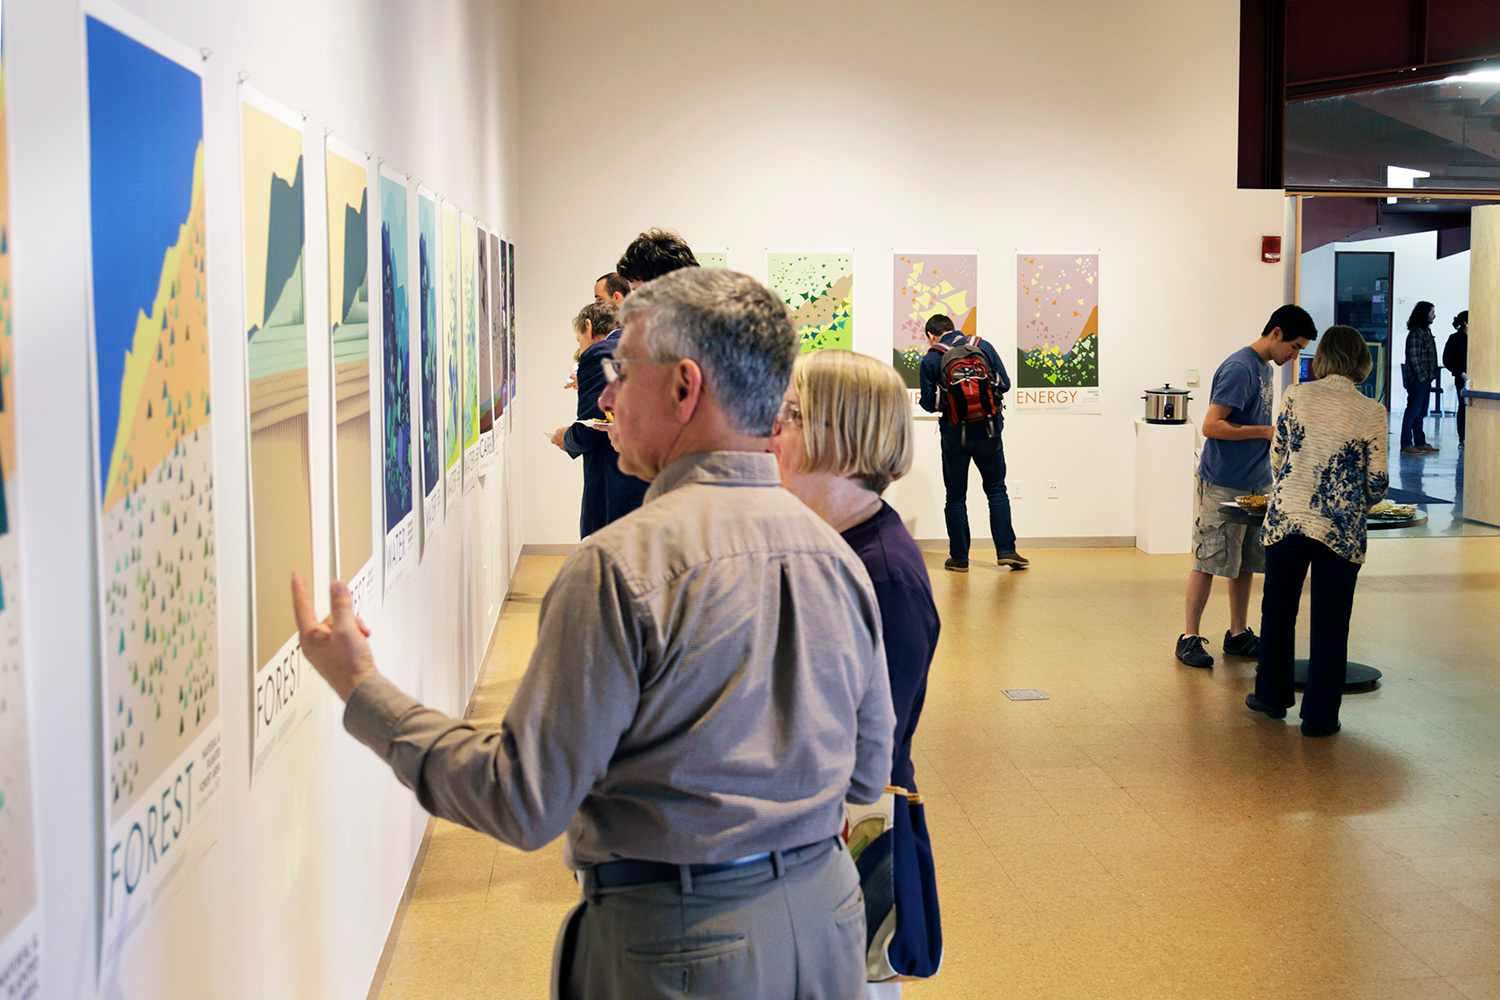
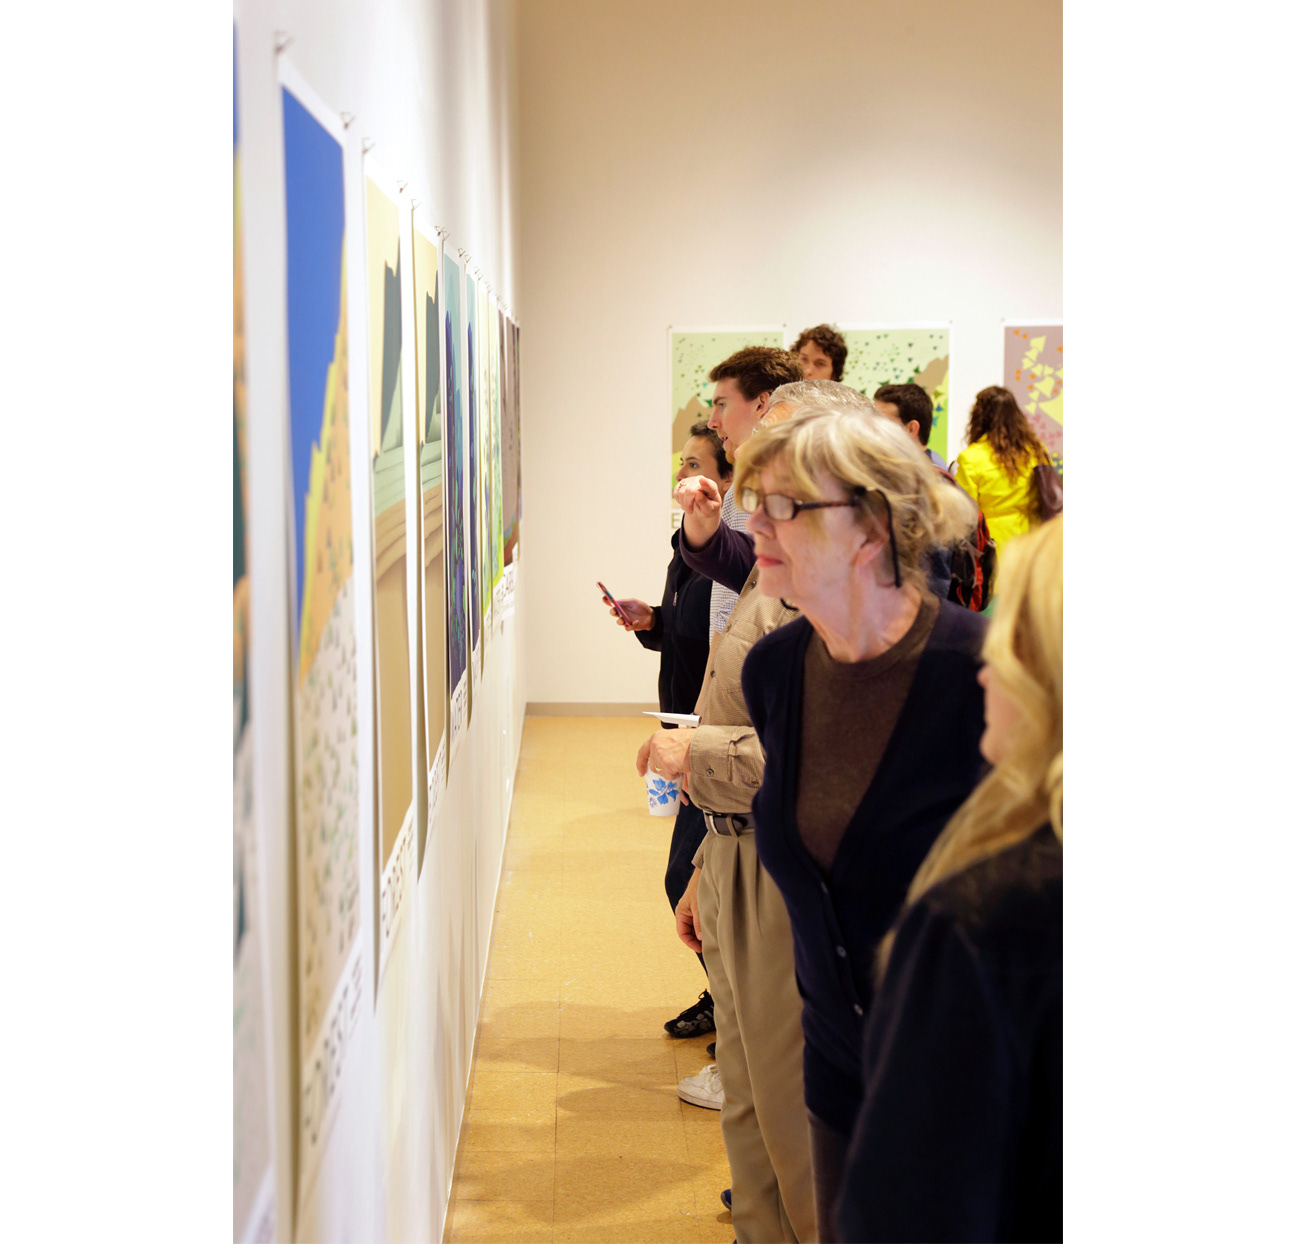
In every composition, there are a multitude of repeated forms of different sizes. Each form belongs to a particular country and the size represents the numerical data value of that country. There are two compositions for each indicator - one that displays total values and one that displays per capita values. Country forms stay in the same location across the two, allowing for insightful comparisons between the per capita and total value compositions. The backgrounds are also infographic in origin and tie in to each indicator's theme.