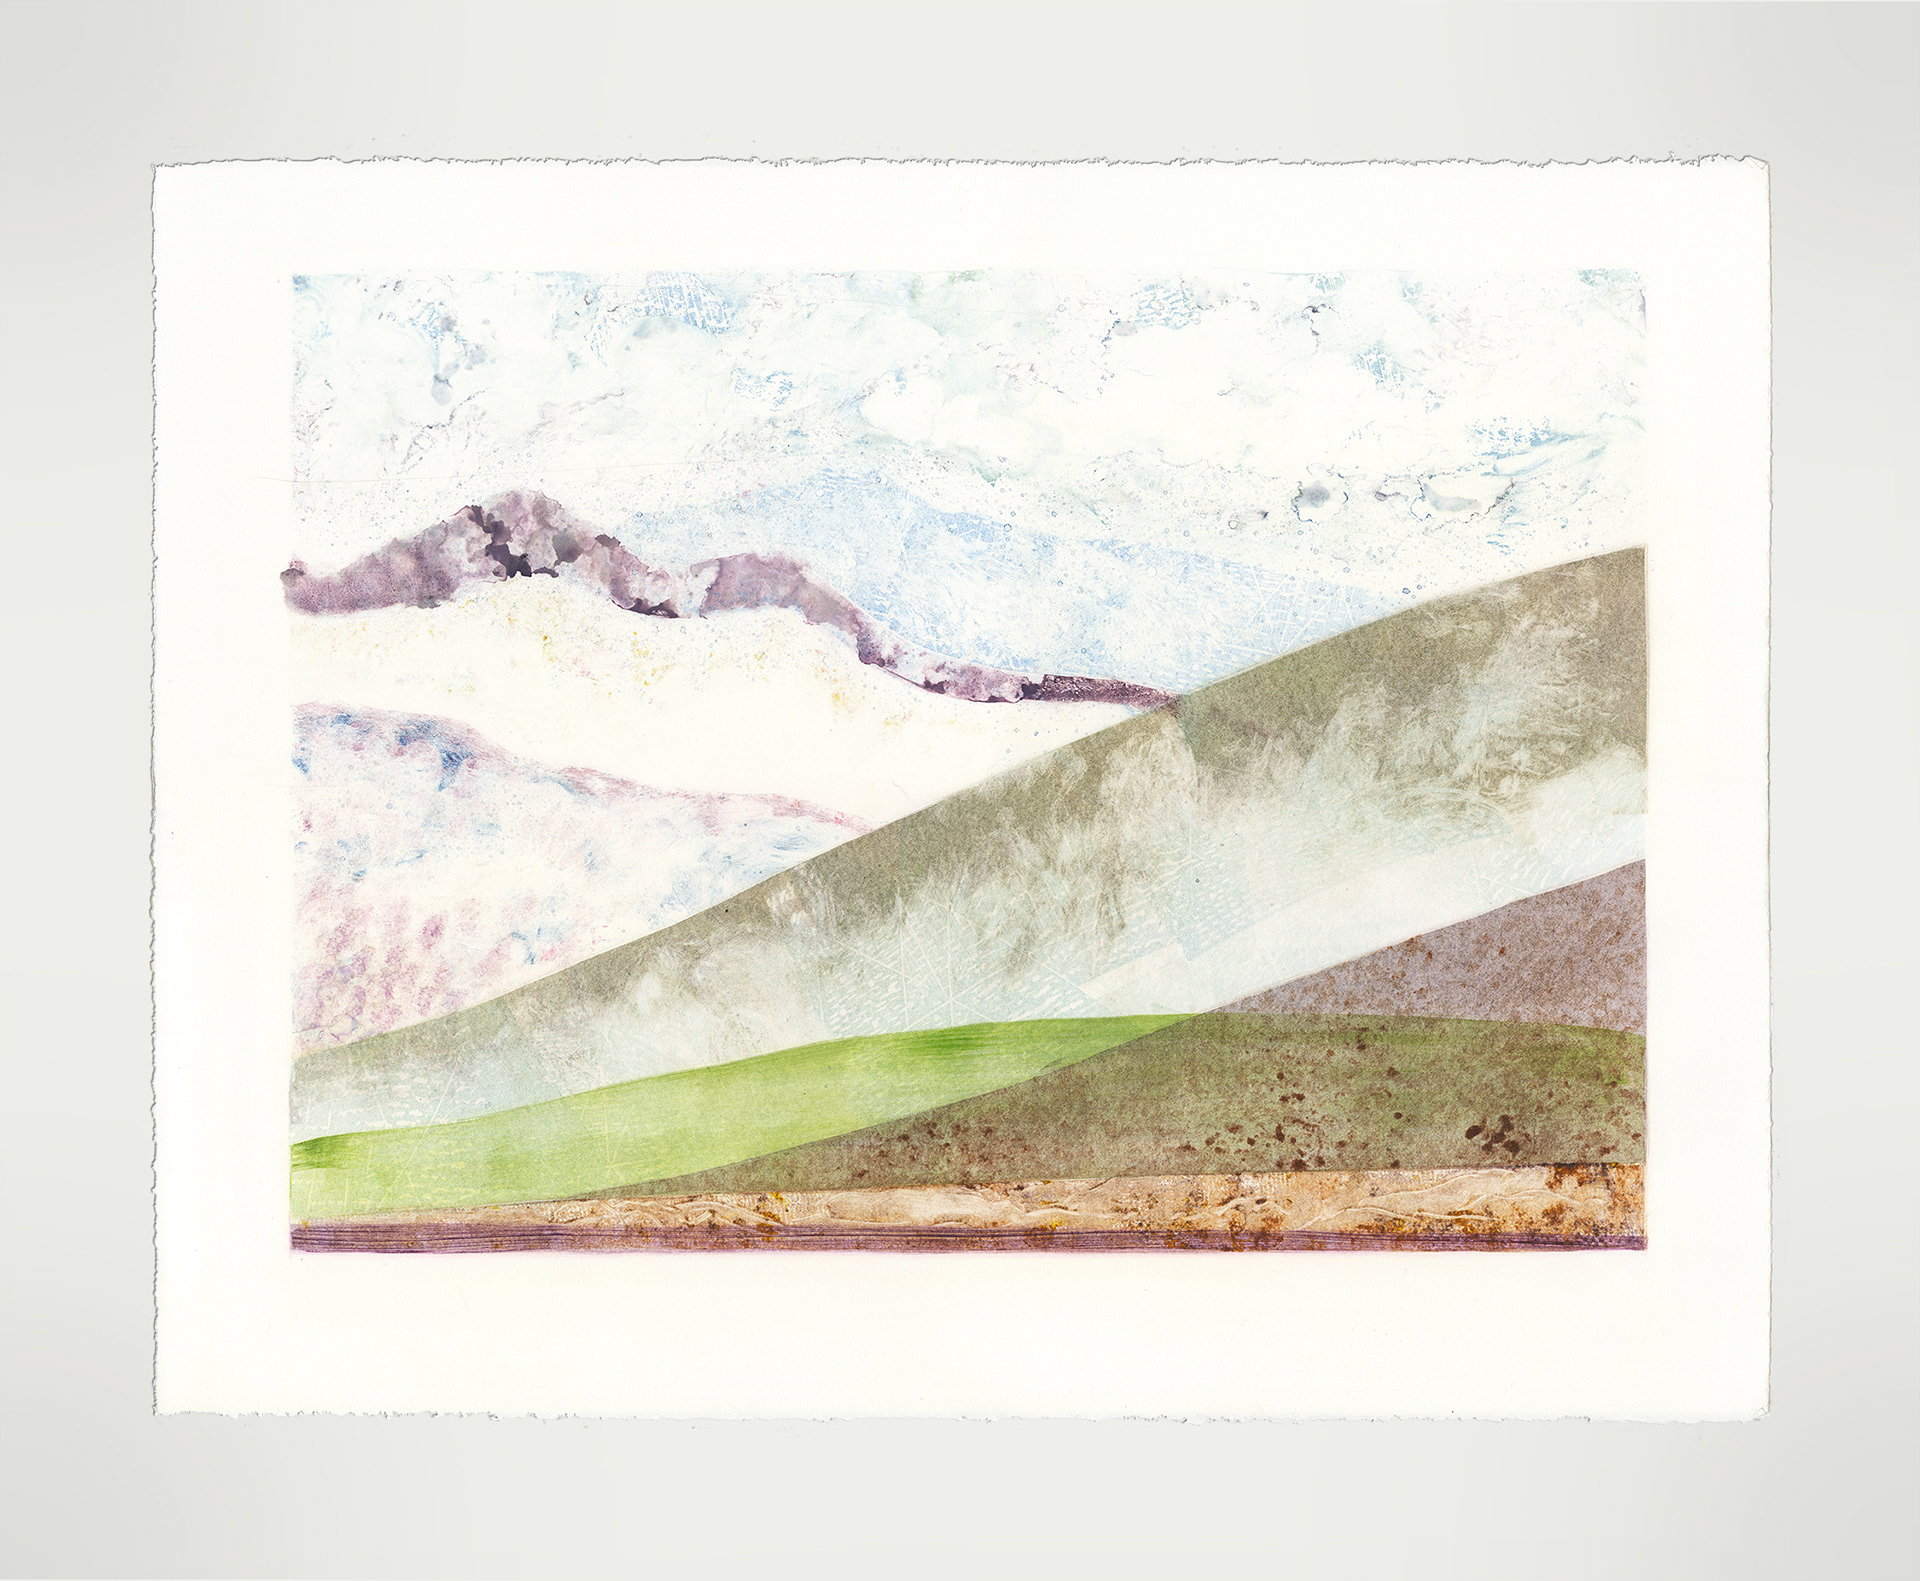
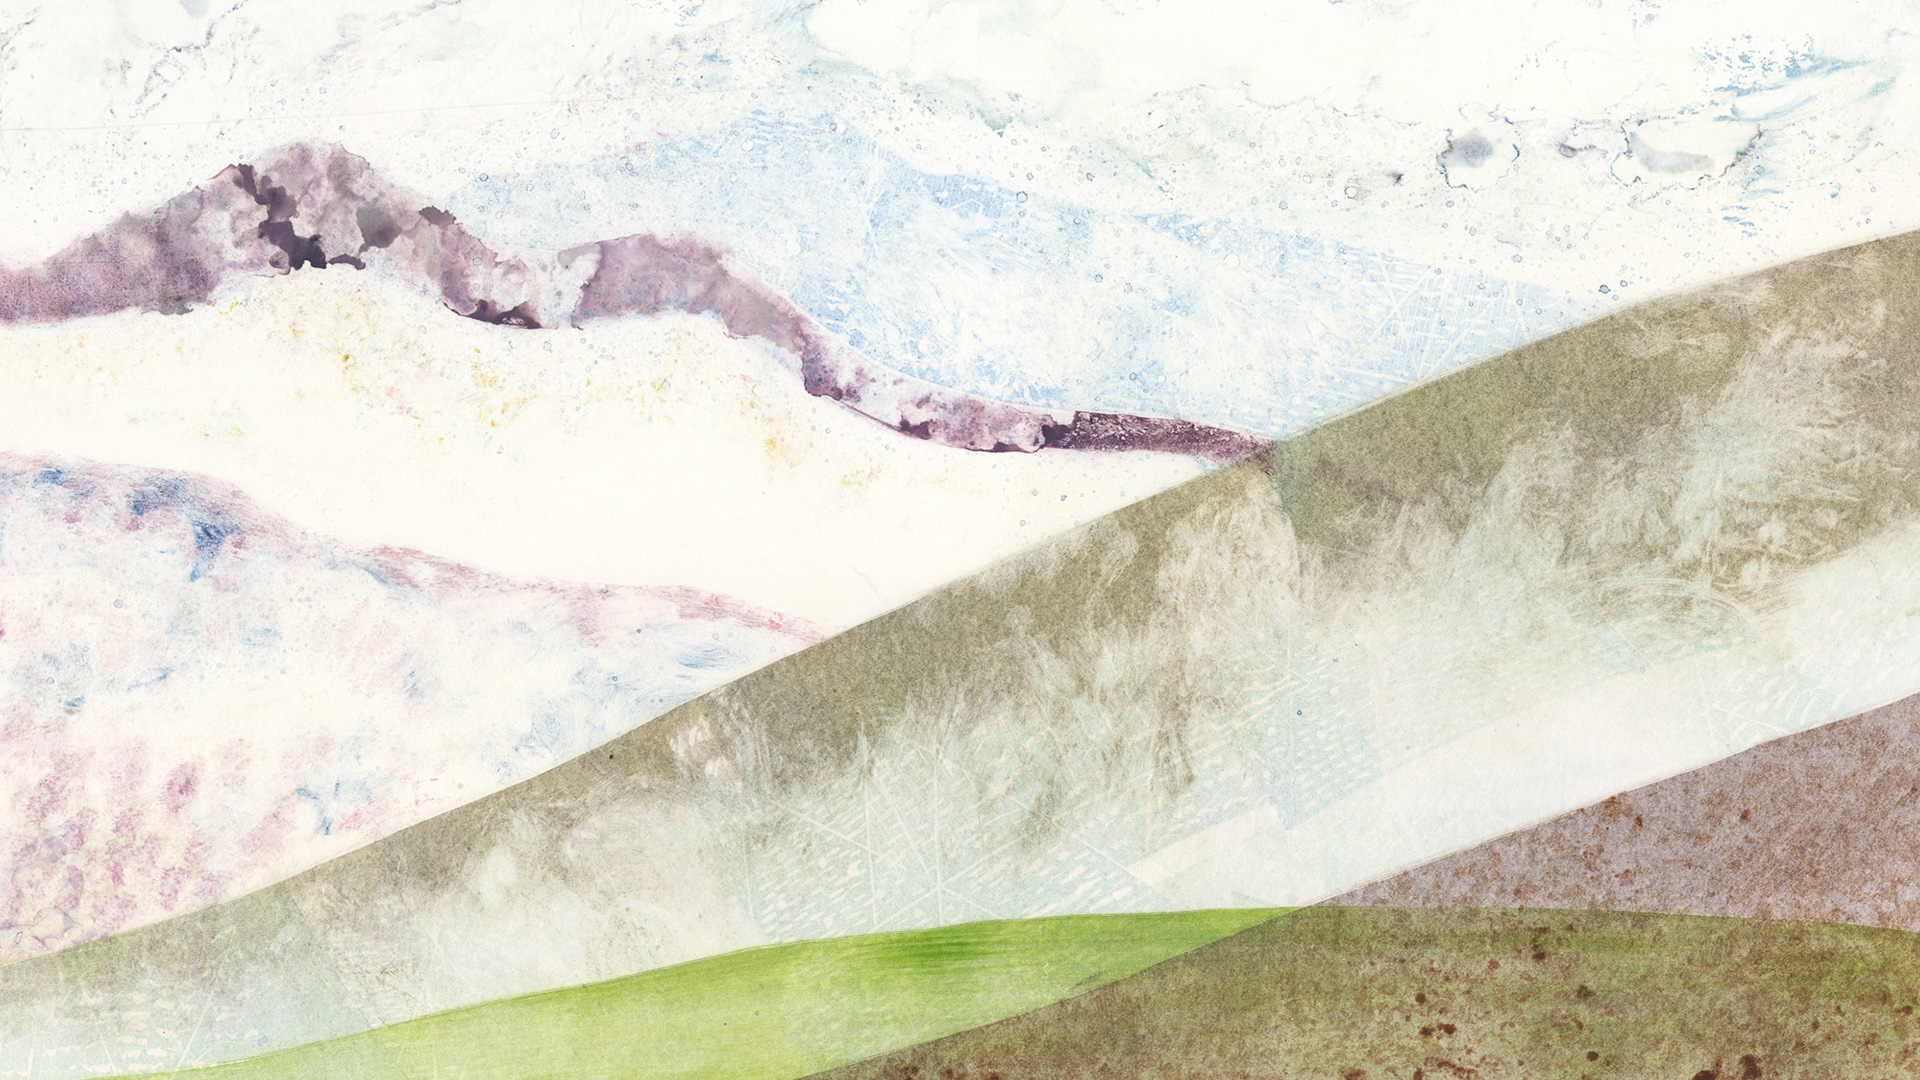
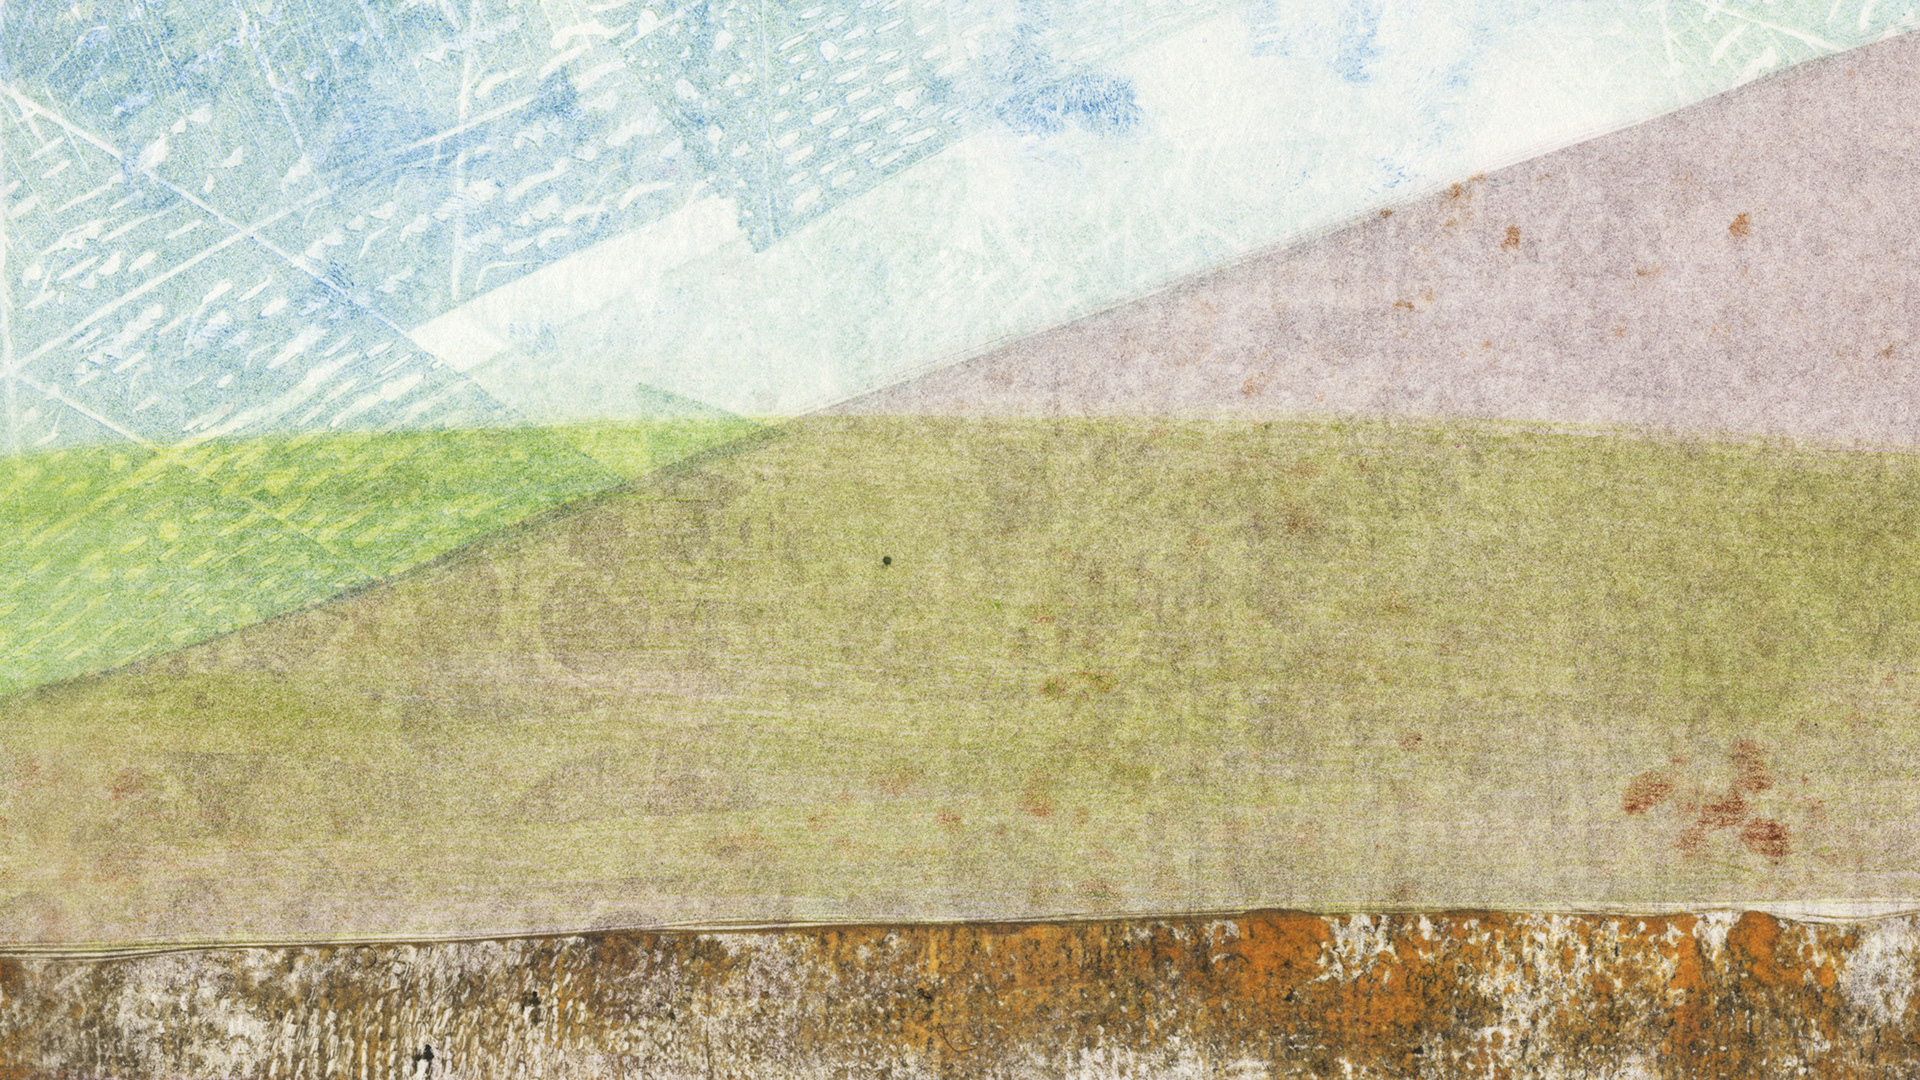
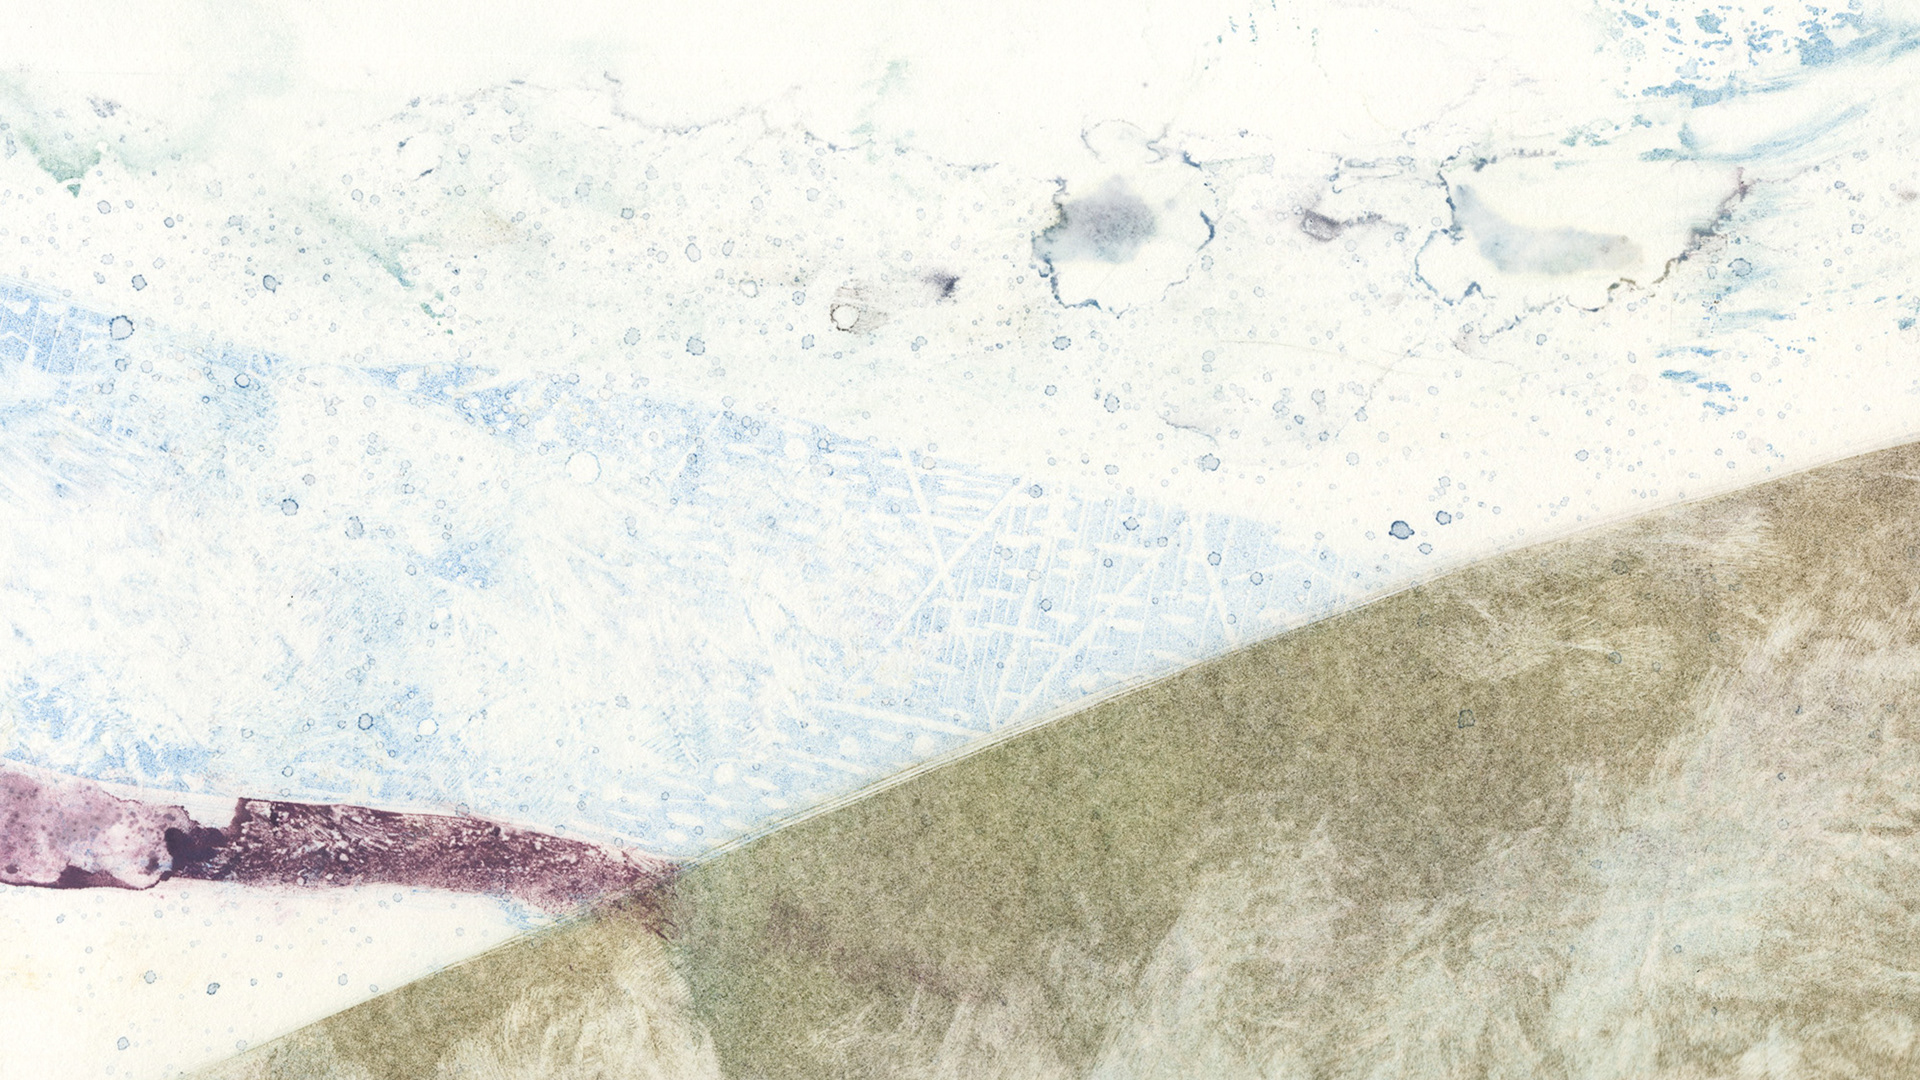
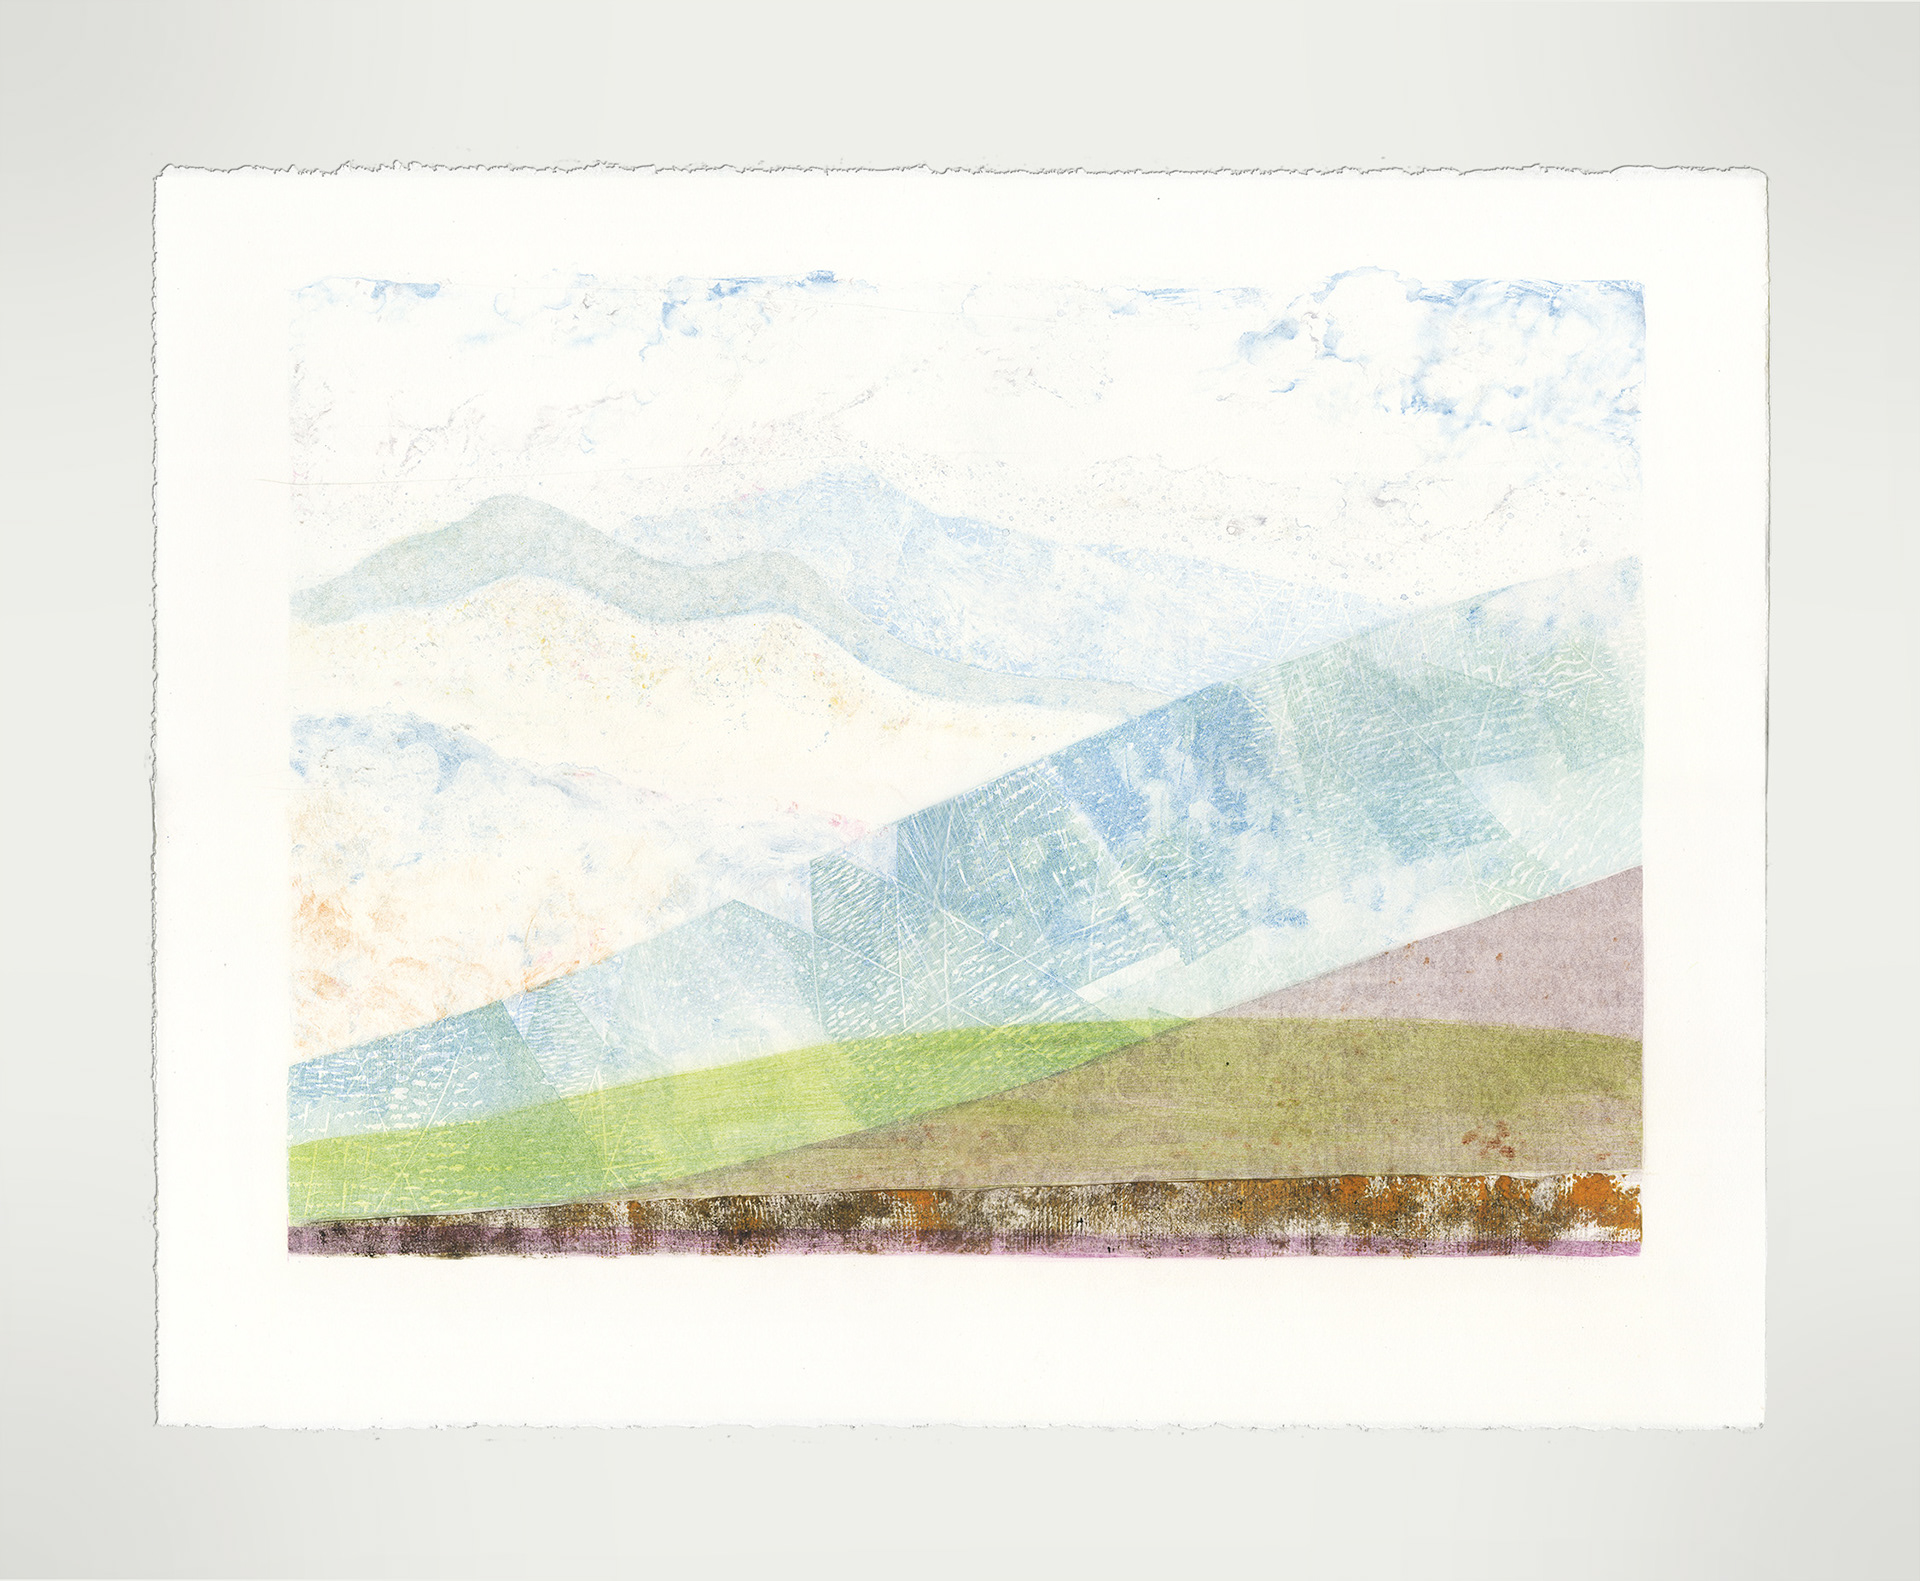
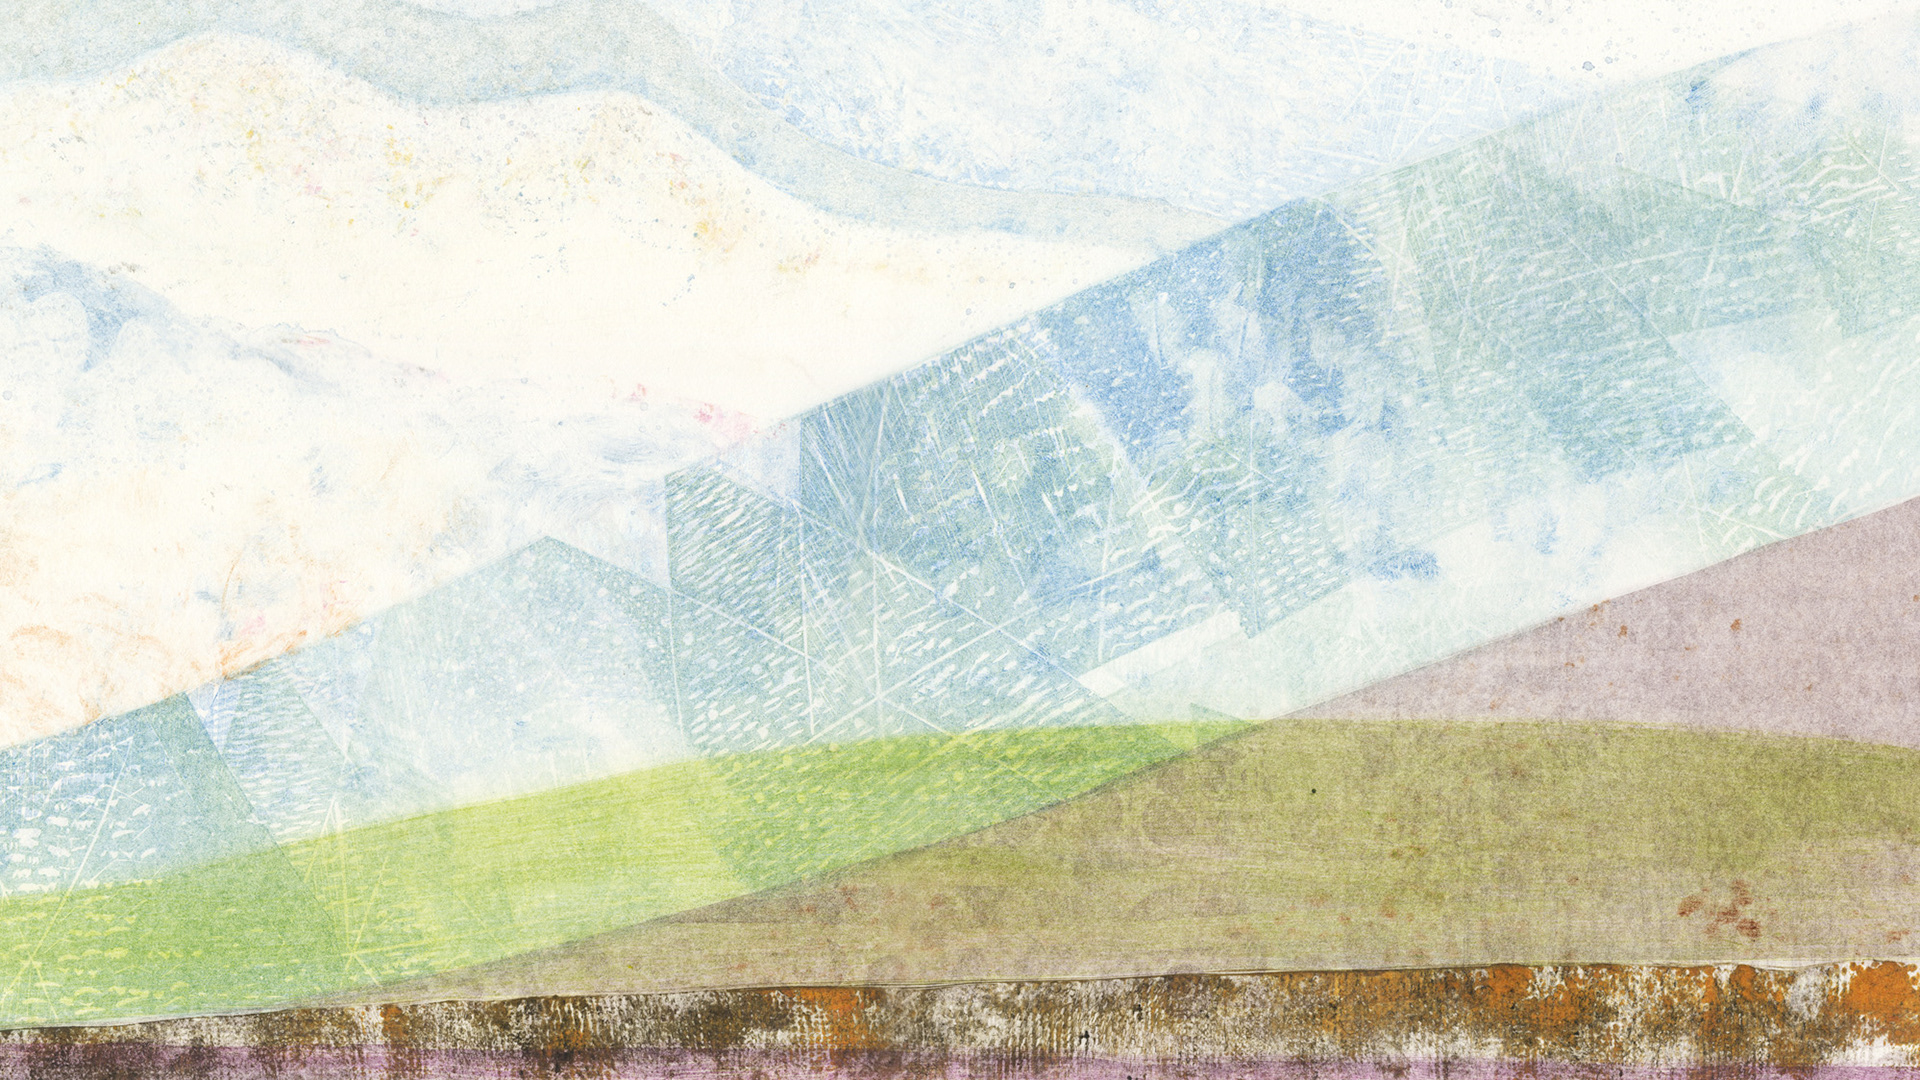
This is a set of 28 x 22 in monotype prints. The images were made by manipulating ink on a plexiglass sheet and printing in multiple runs. Four monotypes of this landscape printed on Rives BFK.
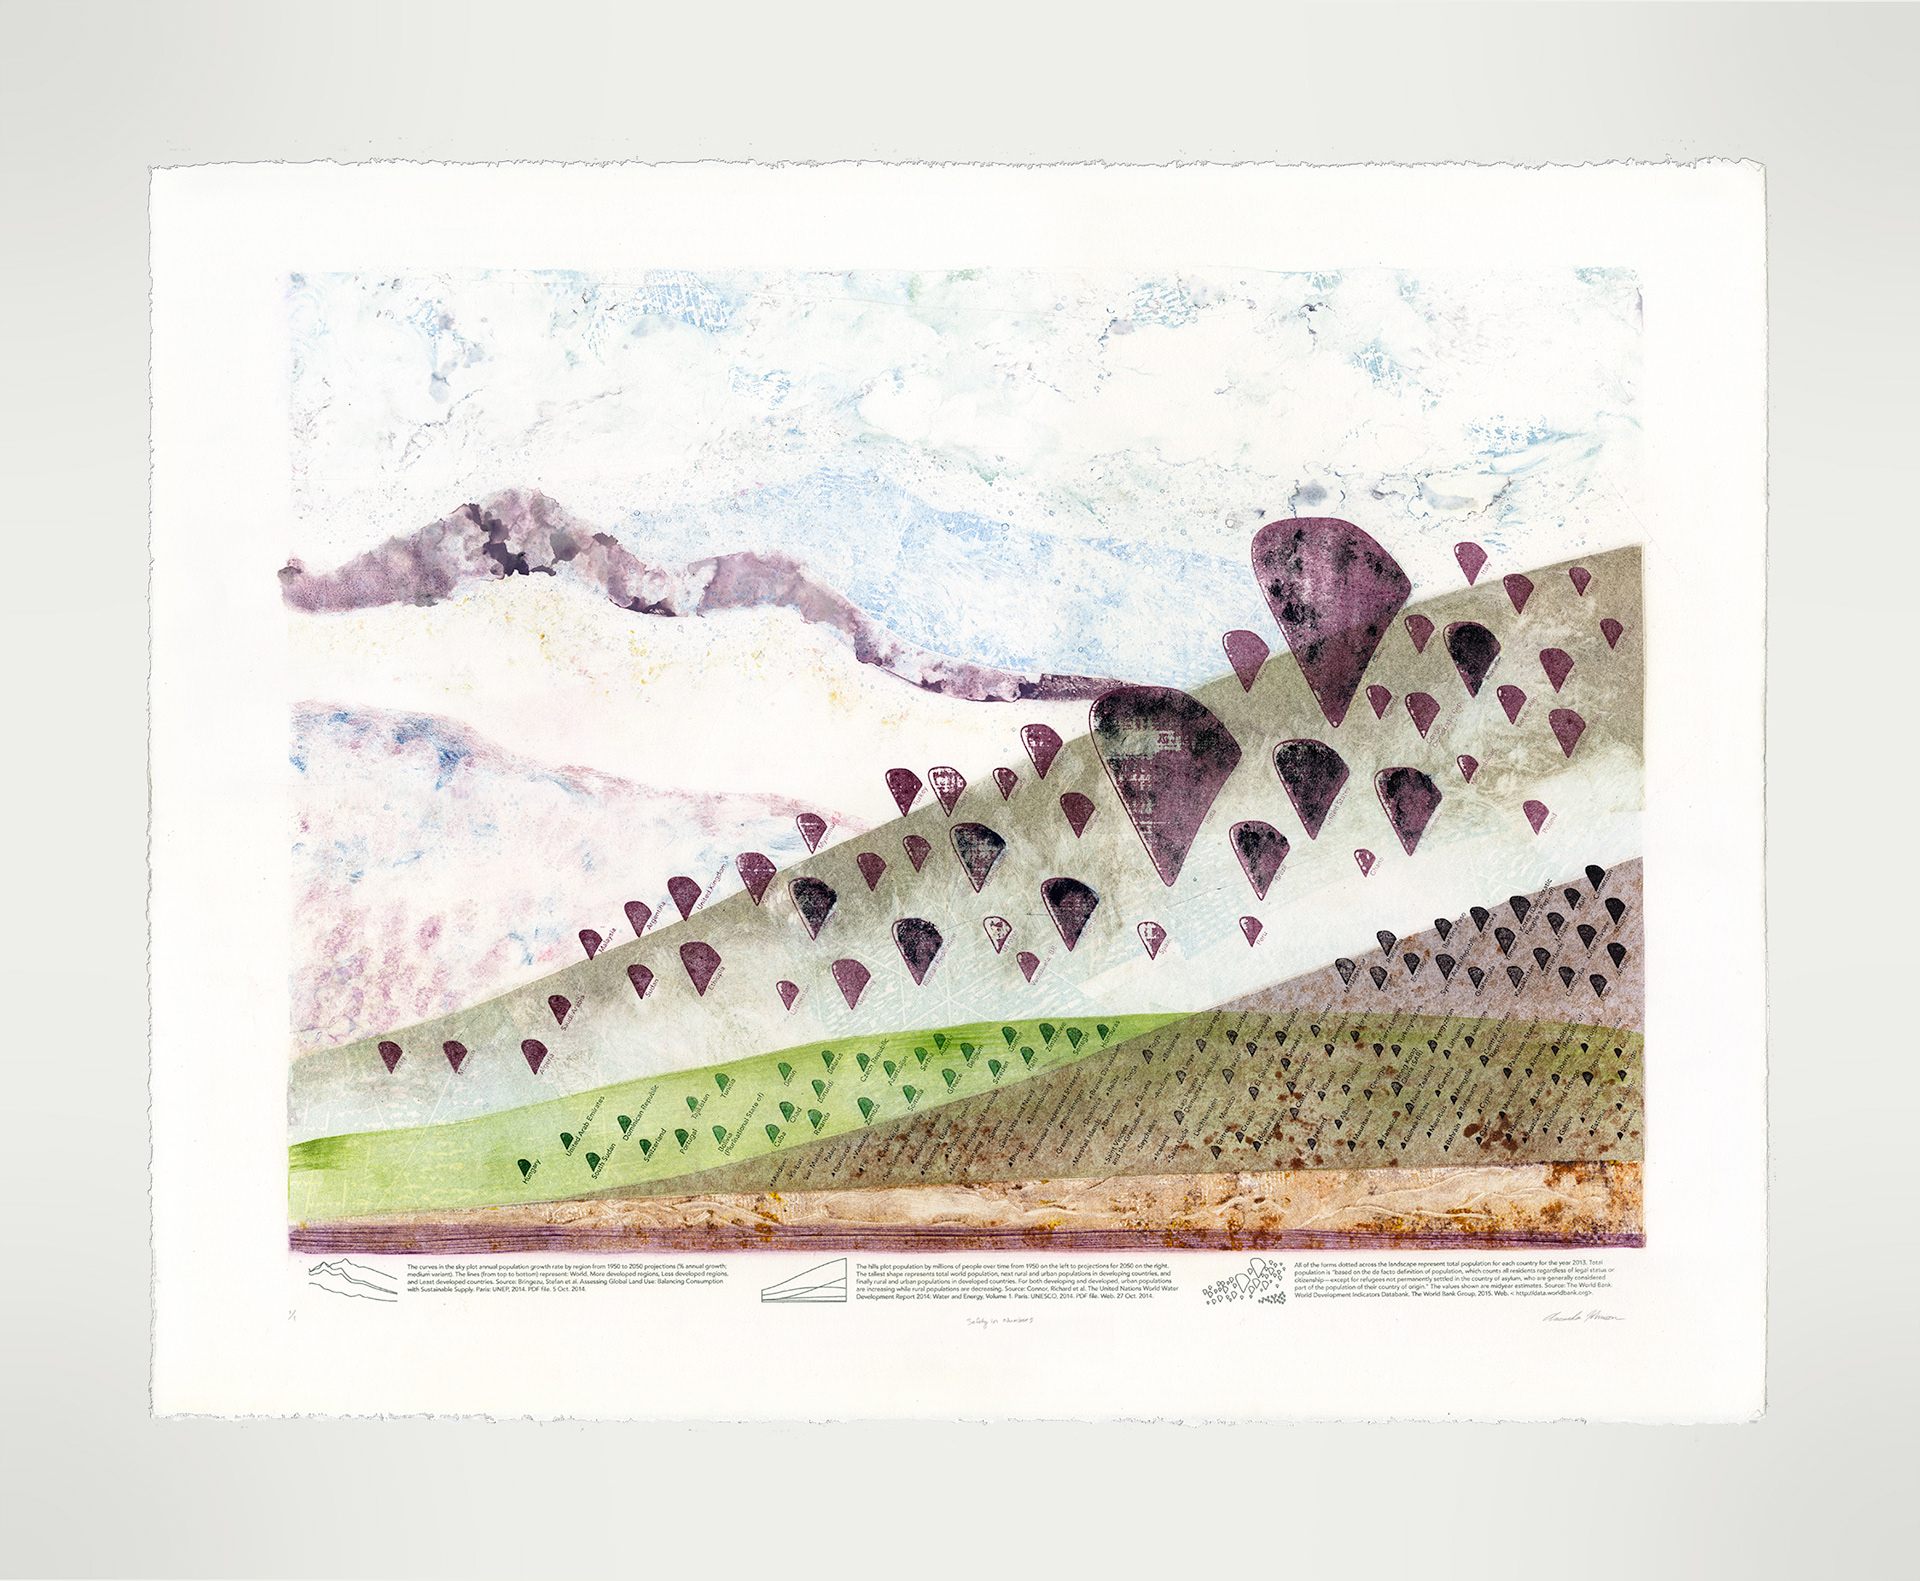
The contours of the landscape are pulled directly from informational charts relating to world population trends over time.
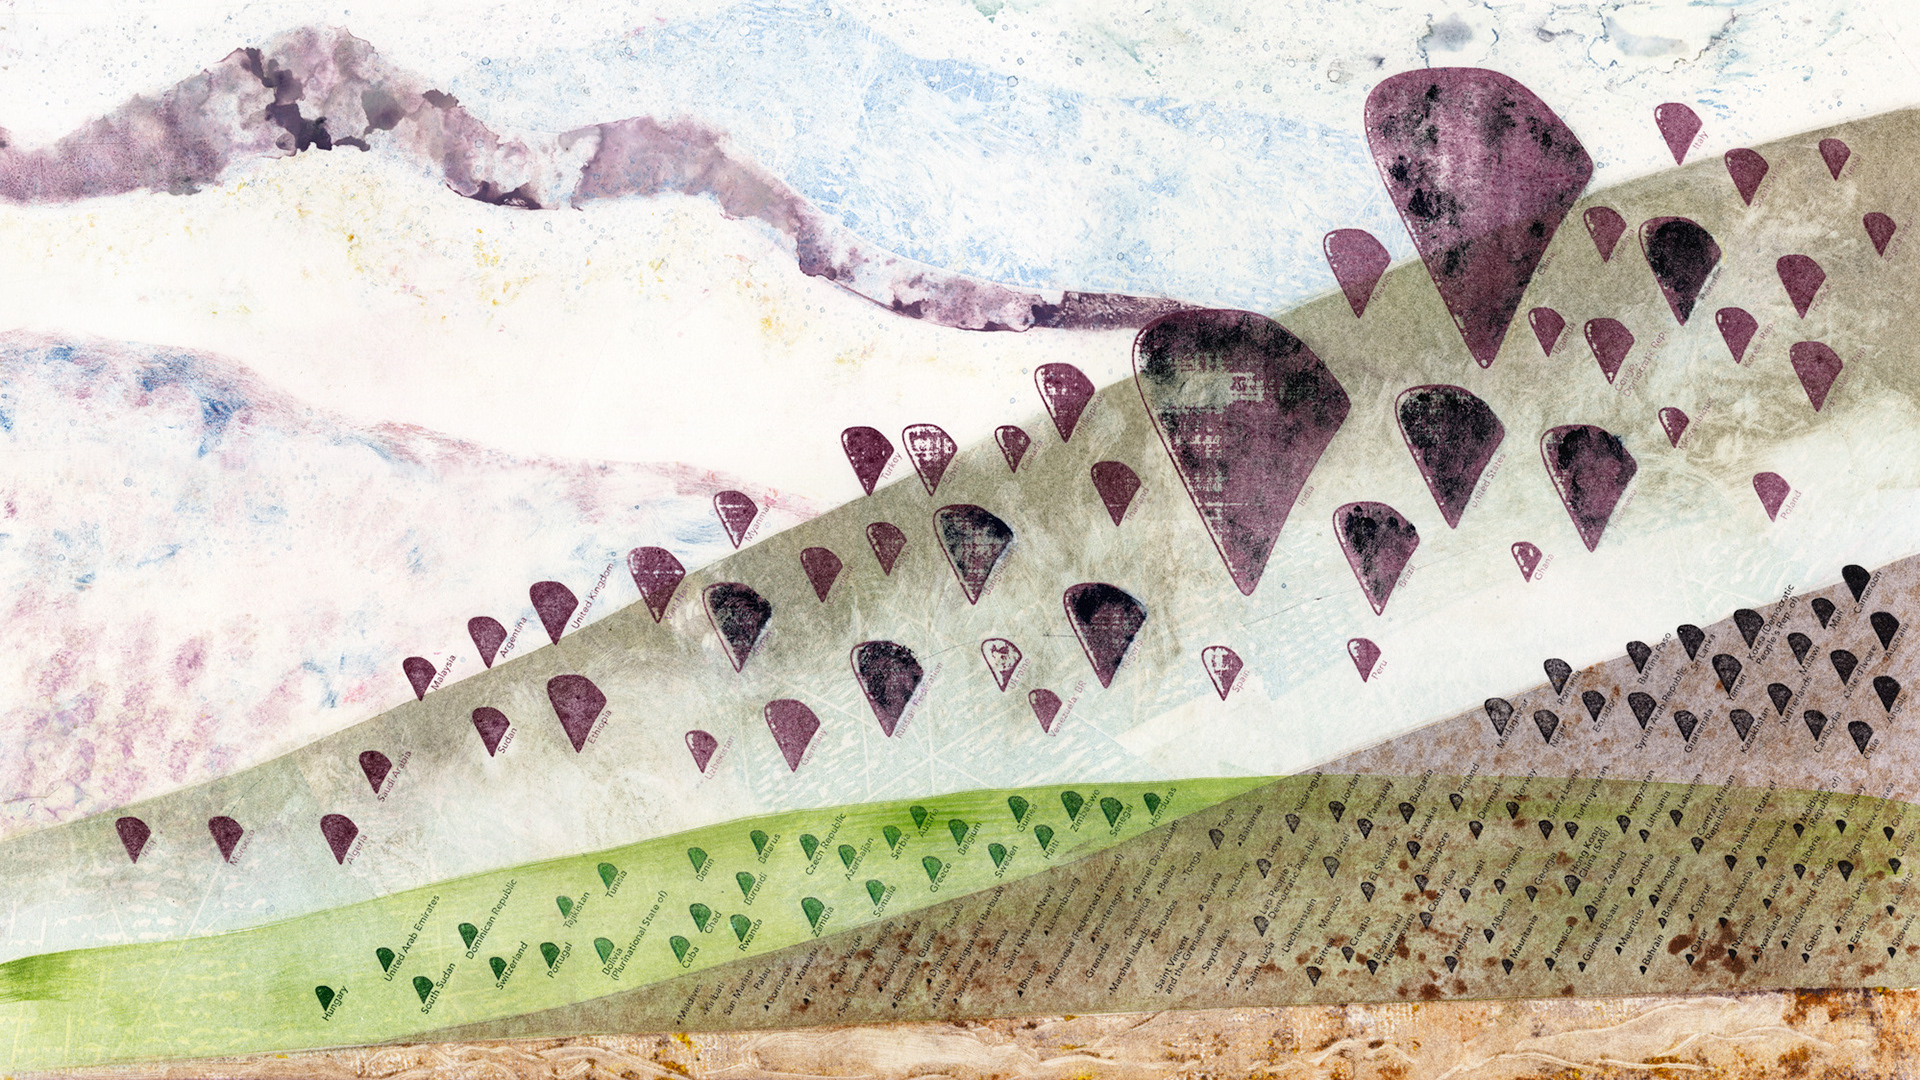
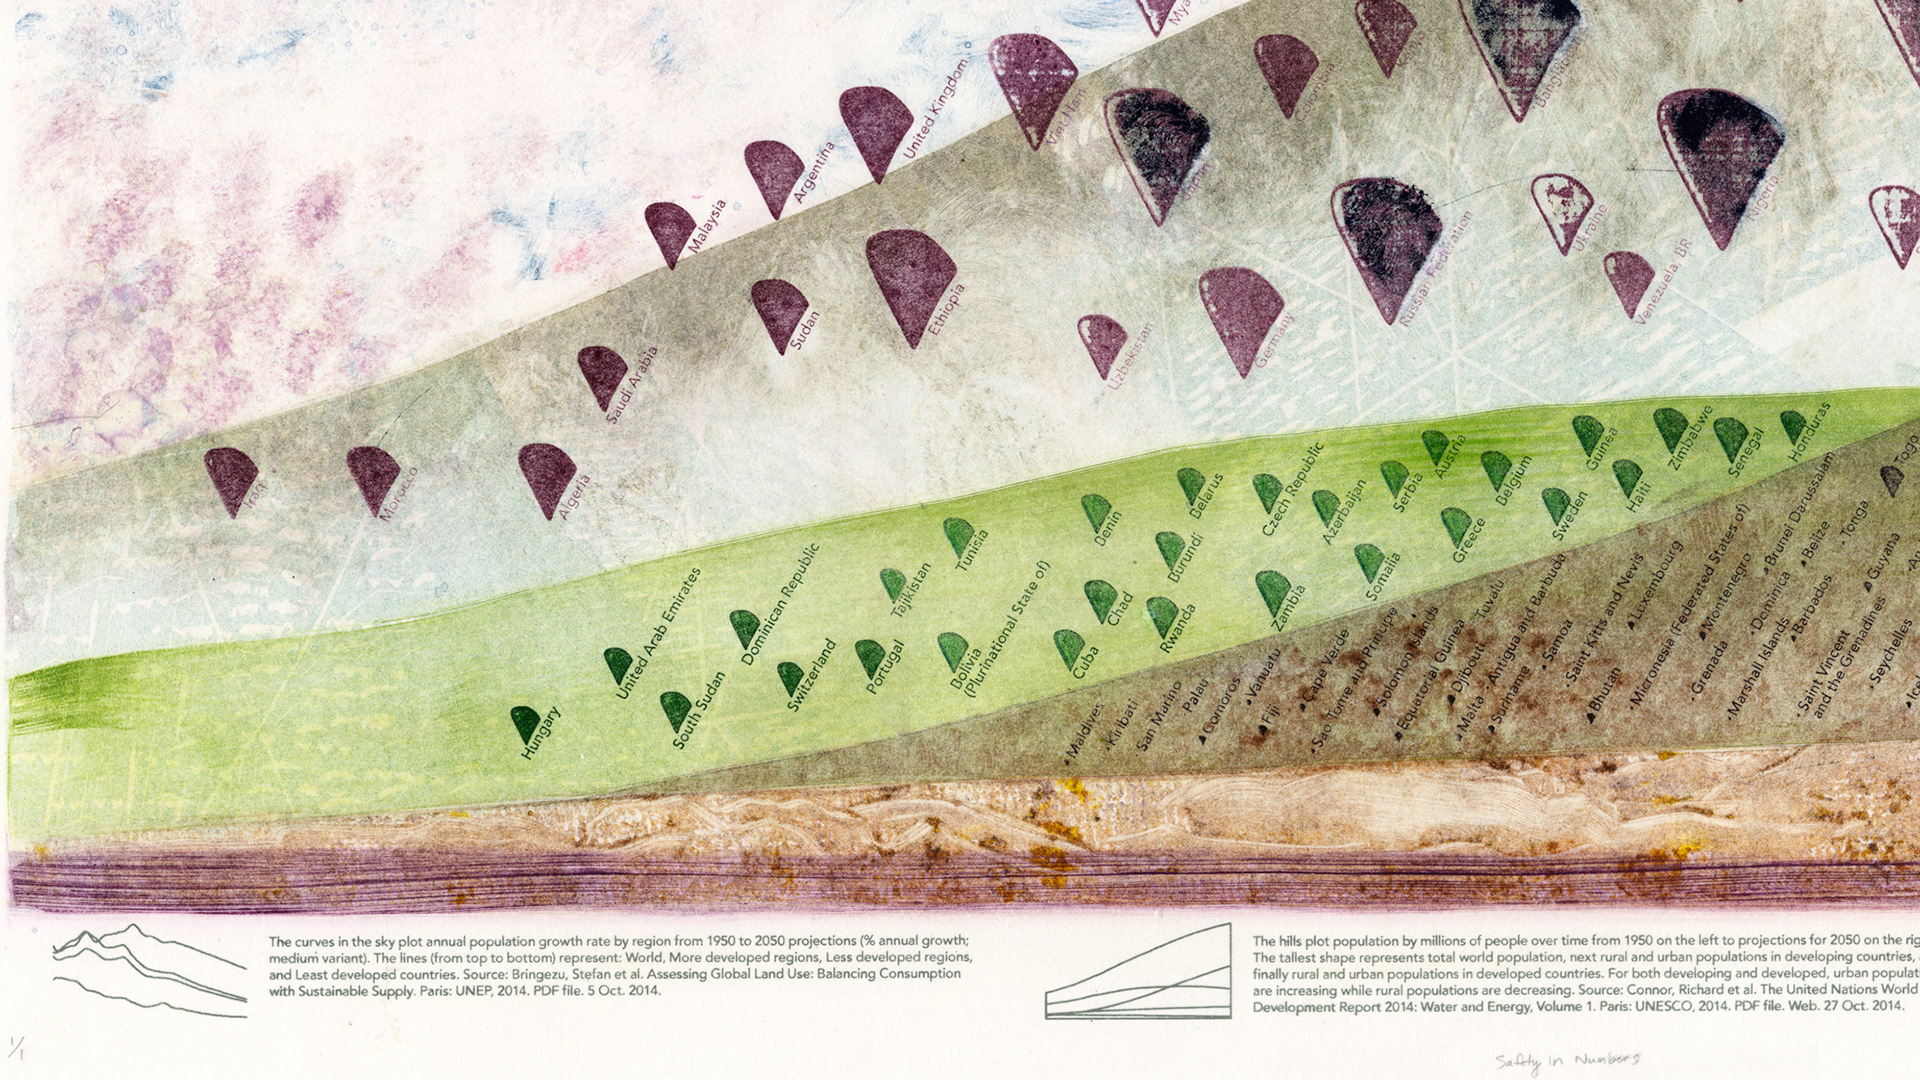
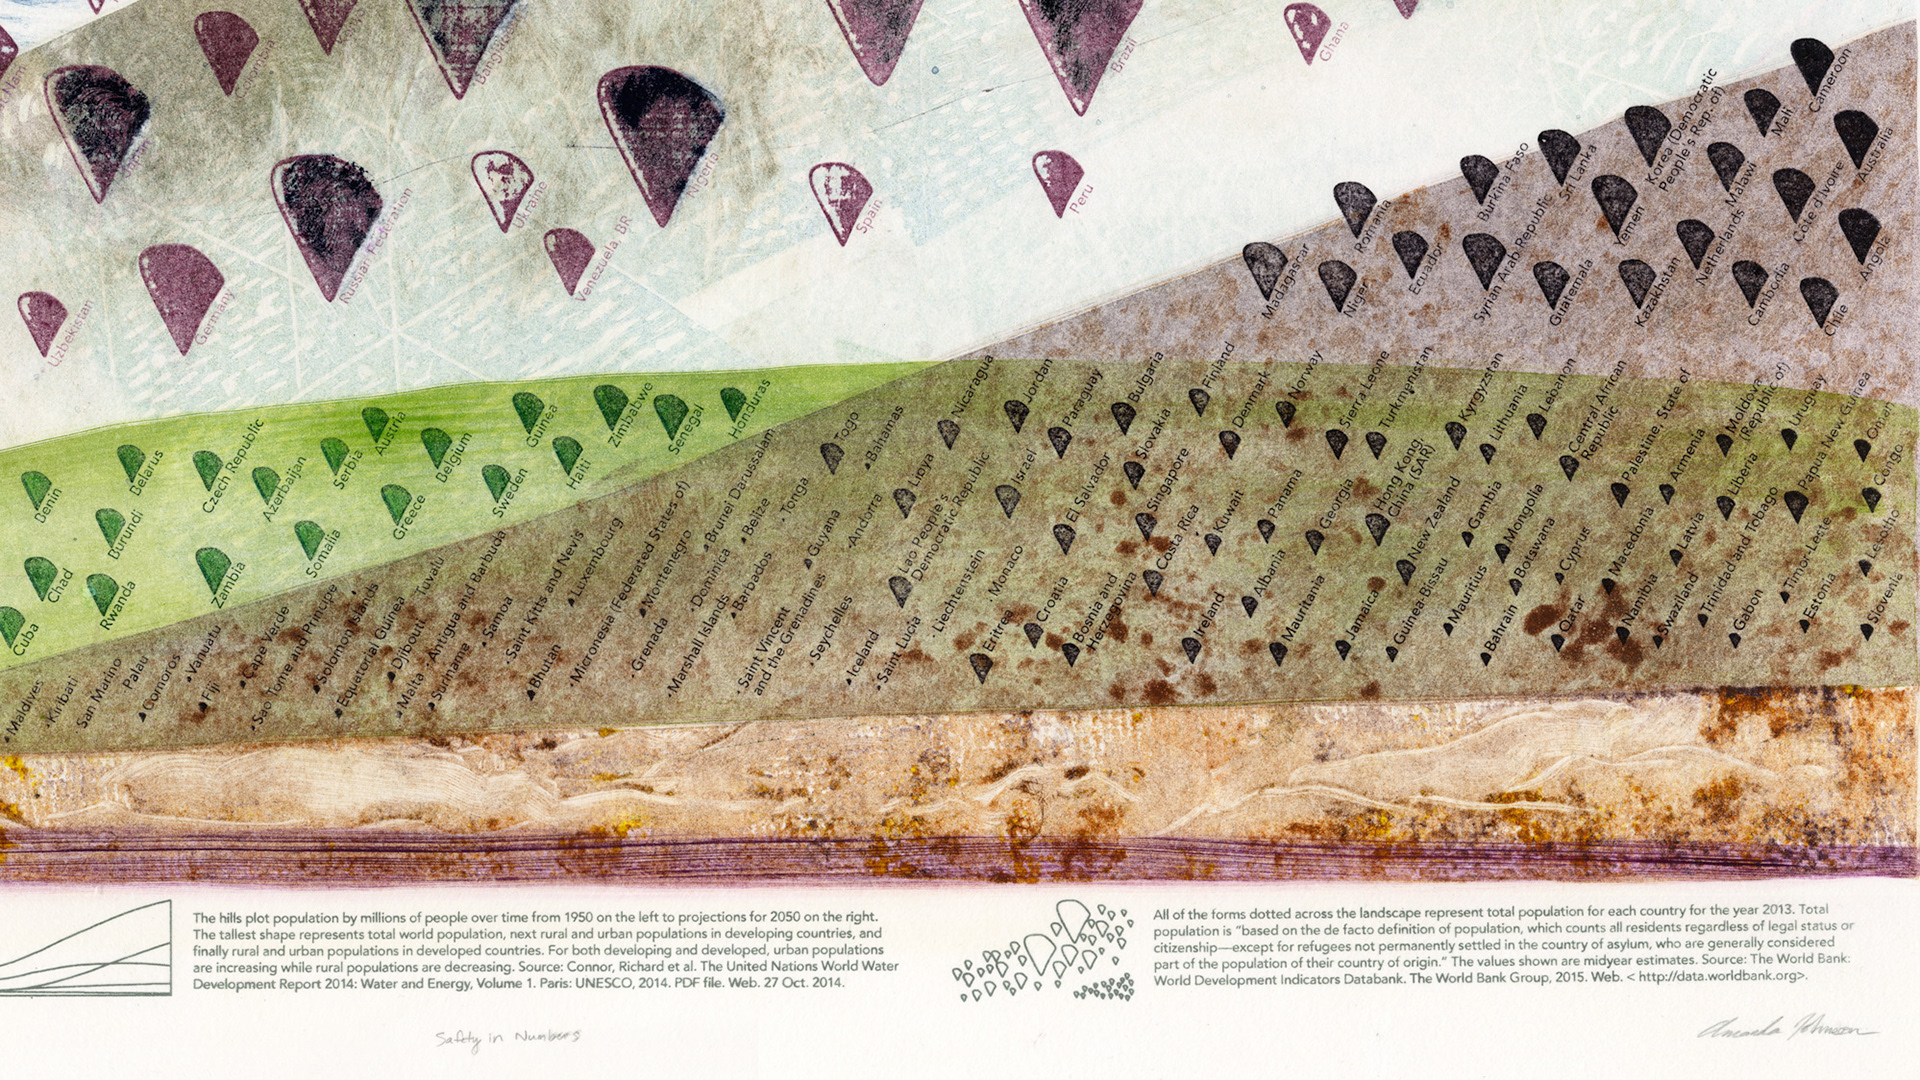
The rising land masses on the lower half of the print plot population by millions of people over time. The tallest shape represents total world population, the two second tallest shapes are rural and urban populations in developing countries, and the two smallest shapes are rural and urban populations in developed countries. The x-axis (width of the image area) represents a 100 year span from 1950 on the far left to projections for 2050 on the far right. Source: UNDESA (2012, fig. 1, p. 3).
The curves in the sky also relate to world population trends, plotting annual growth rate by regions from 1950-2050 (% annual growth; medium variant). The lines (from top to bottom) represent: World, More developed regions, Less developed regions, and Least developed countries. Source: Drawn from UN World Population Propects, the 2012 Revision (UN 2013).
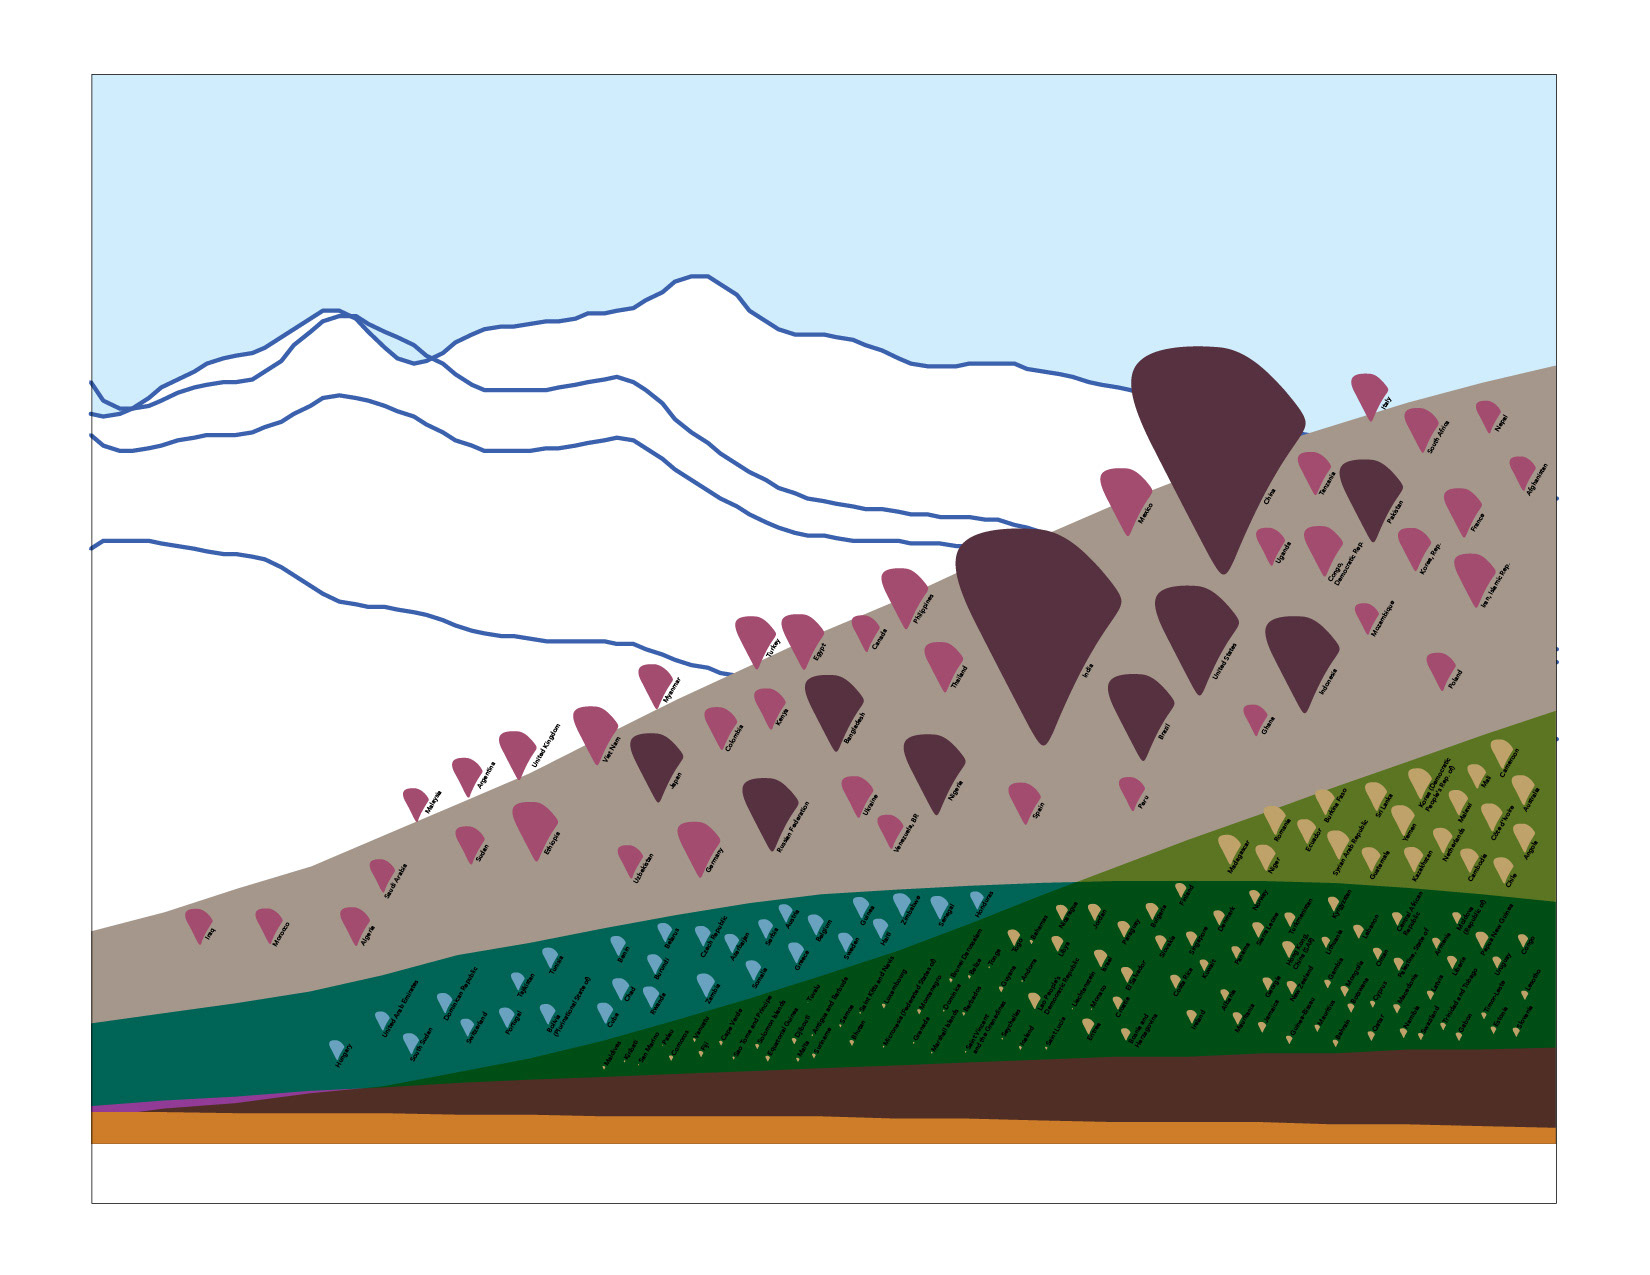
Design template rendered in Adobe Illustrator.
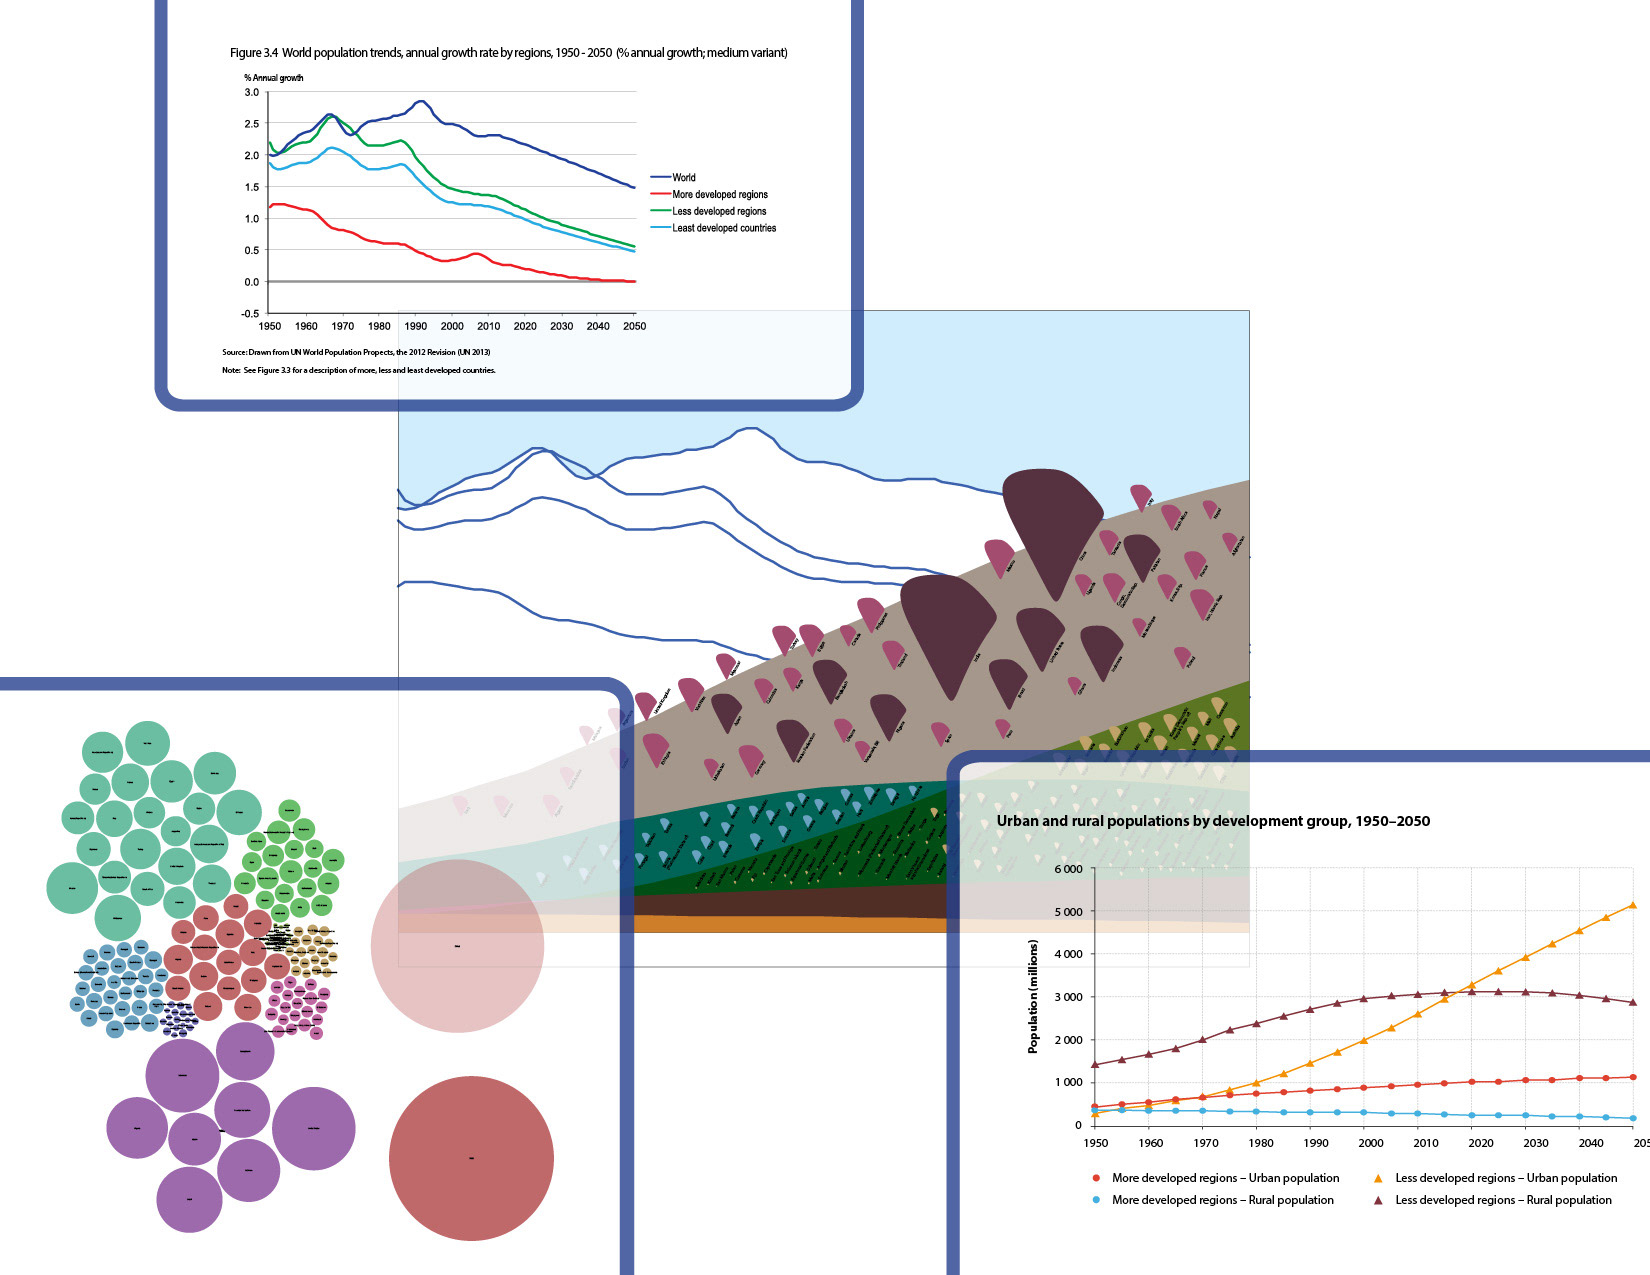
The three original charts which informed the shape of the landscape.
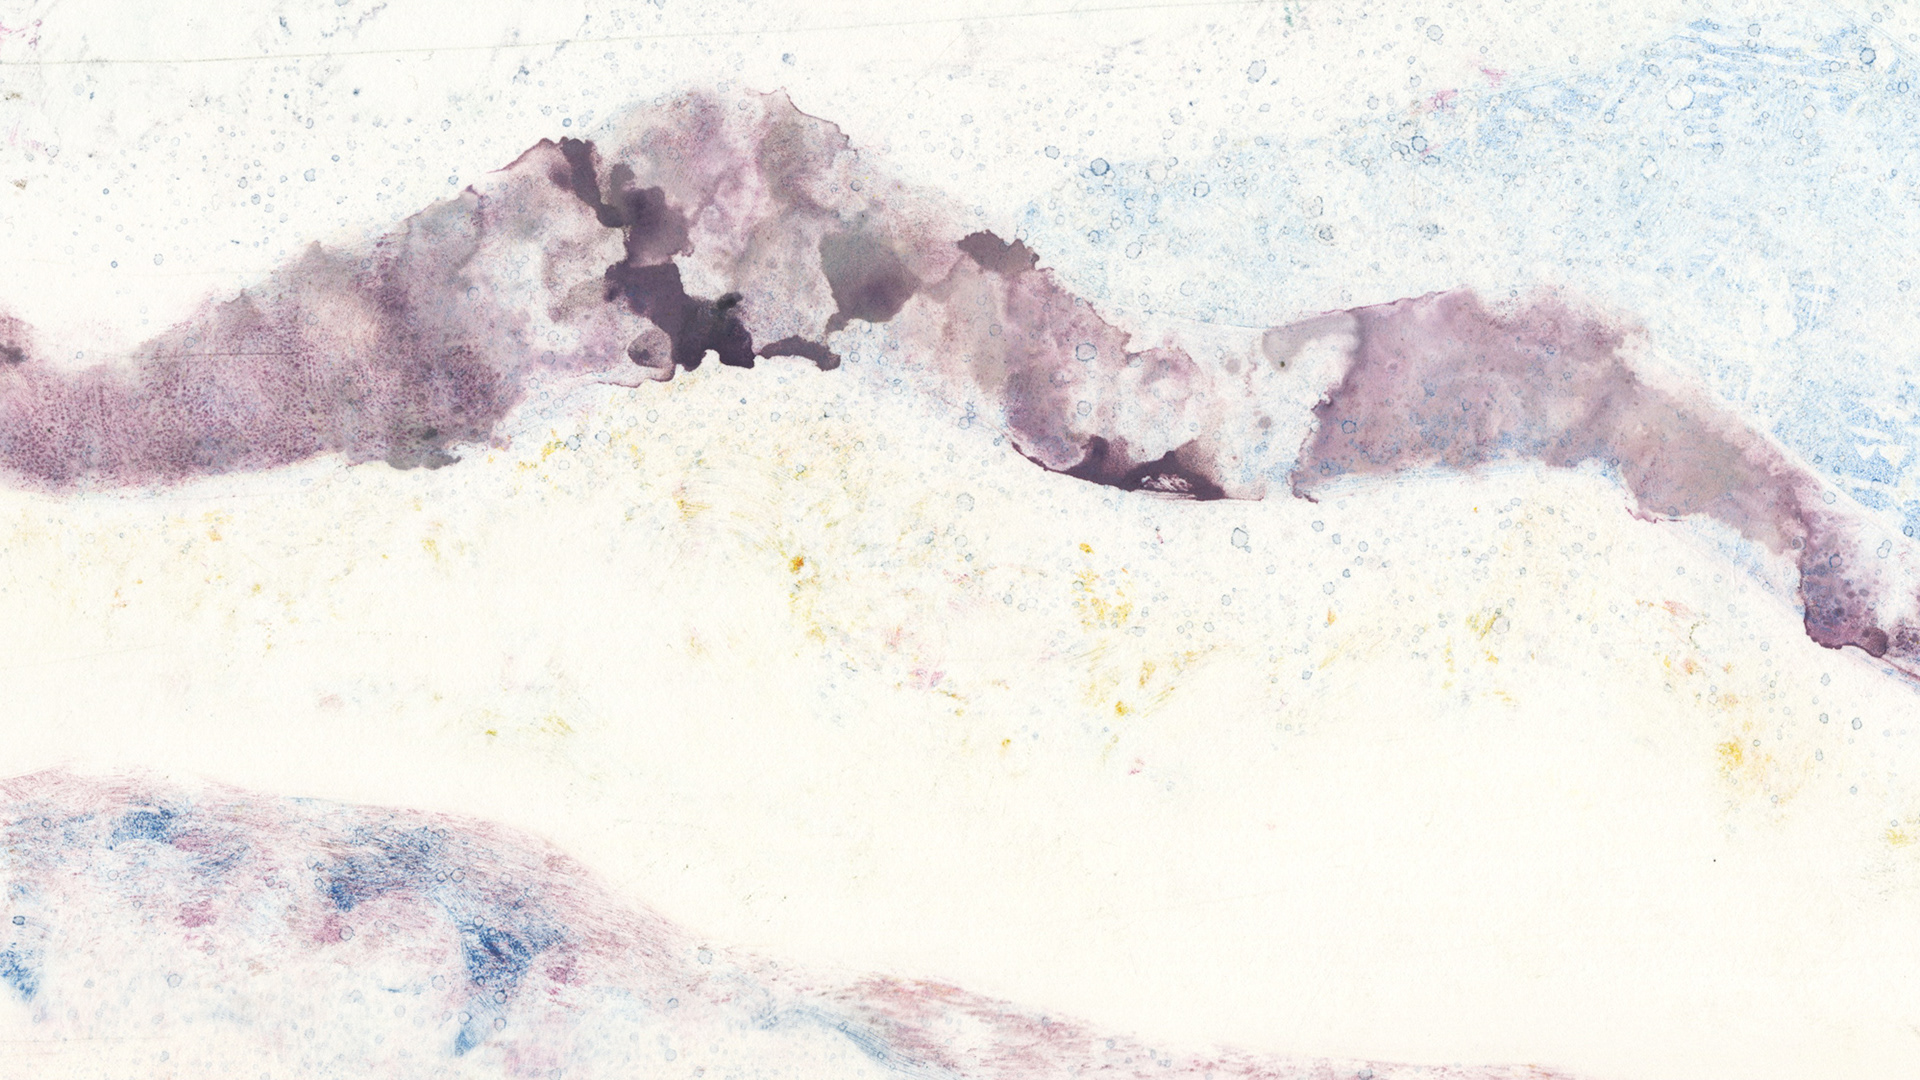

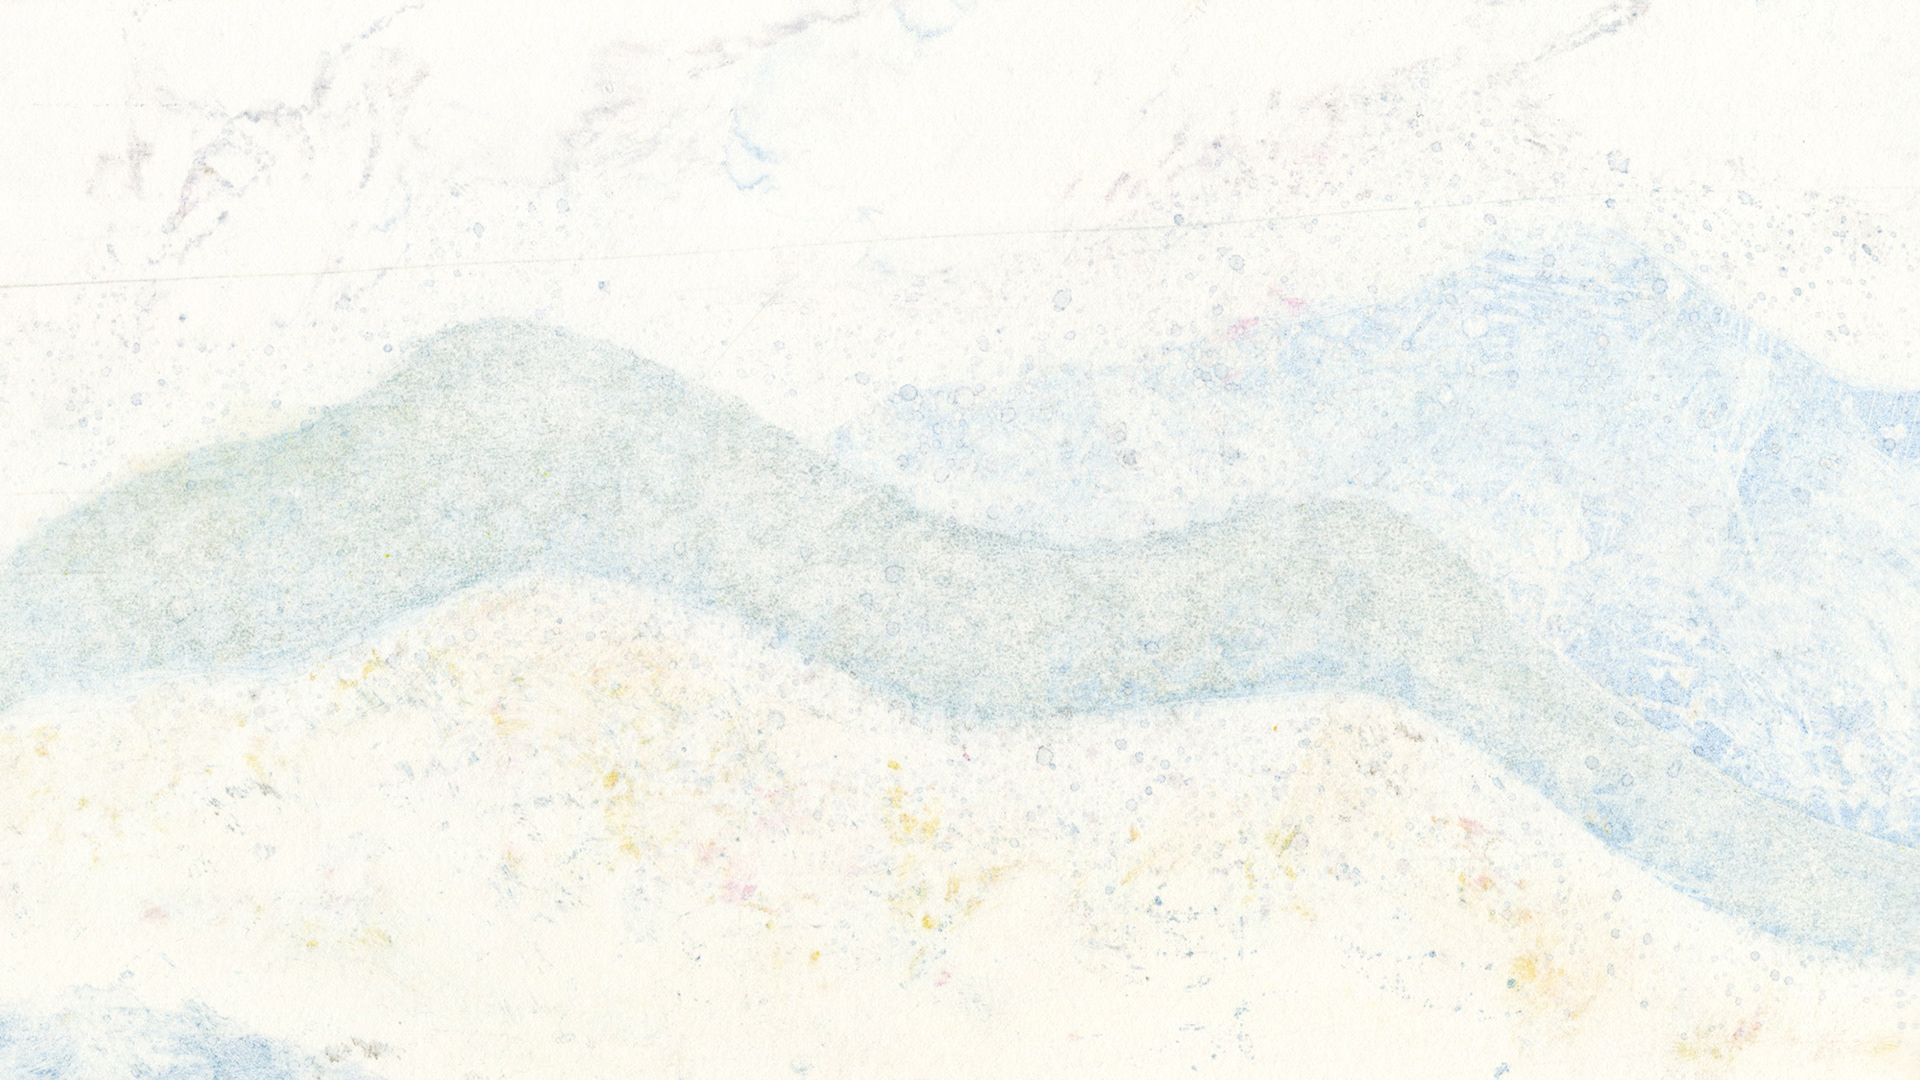
Print in progress before adding bubble chart and text labels.
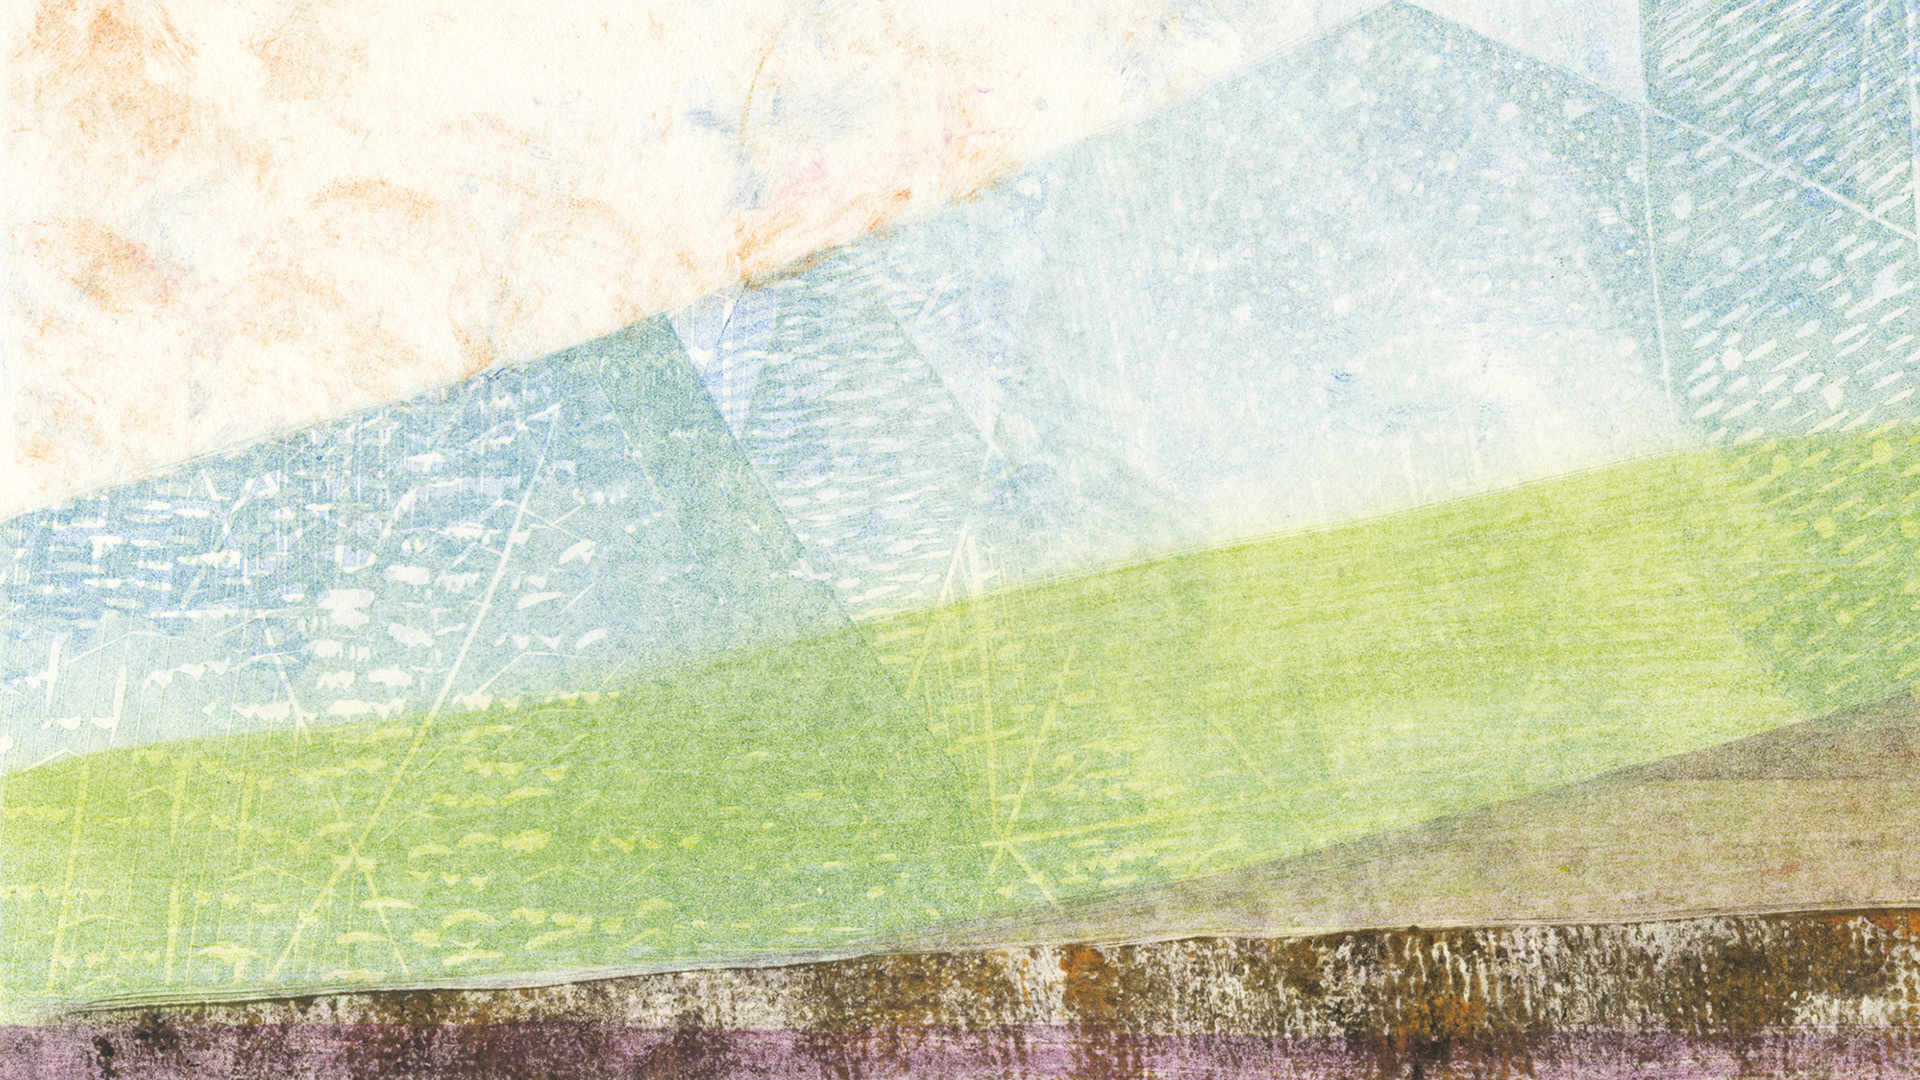
A different print in progress.

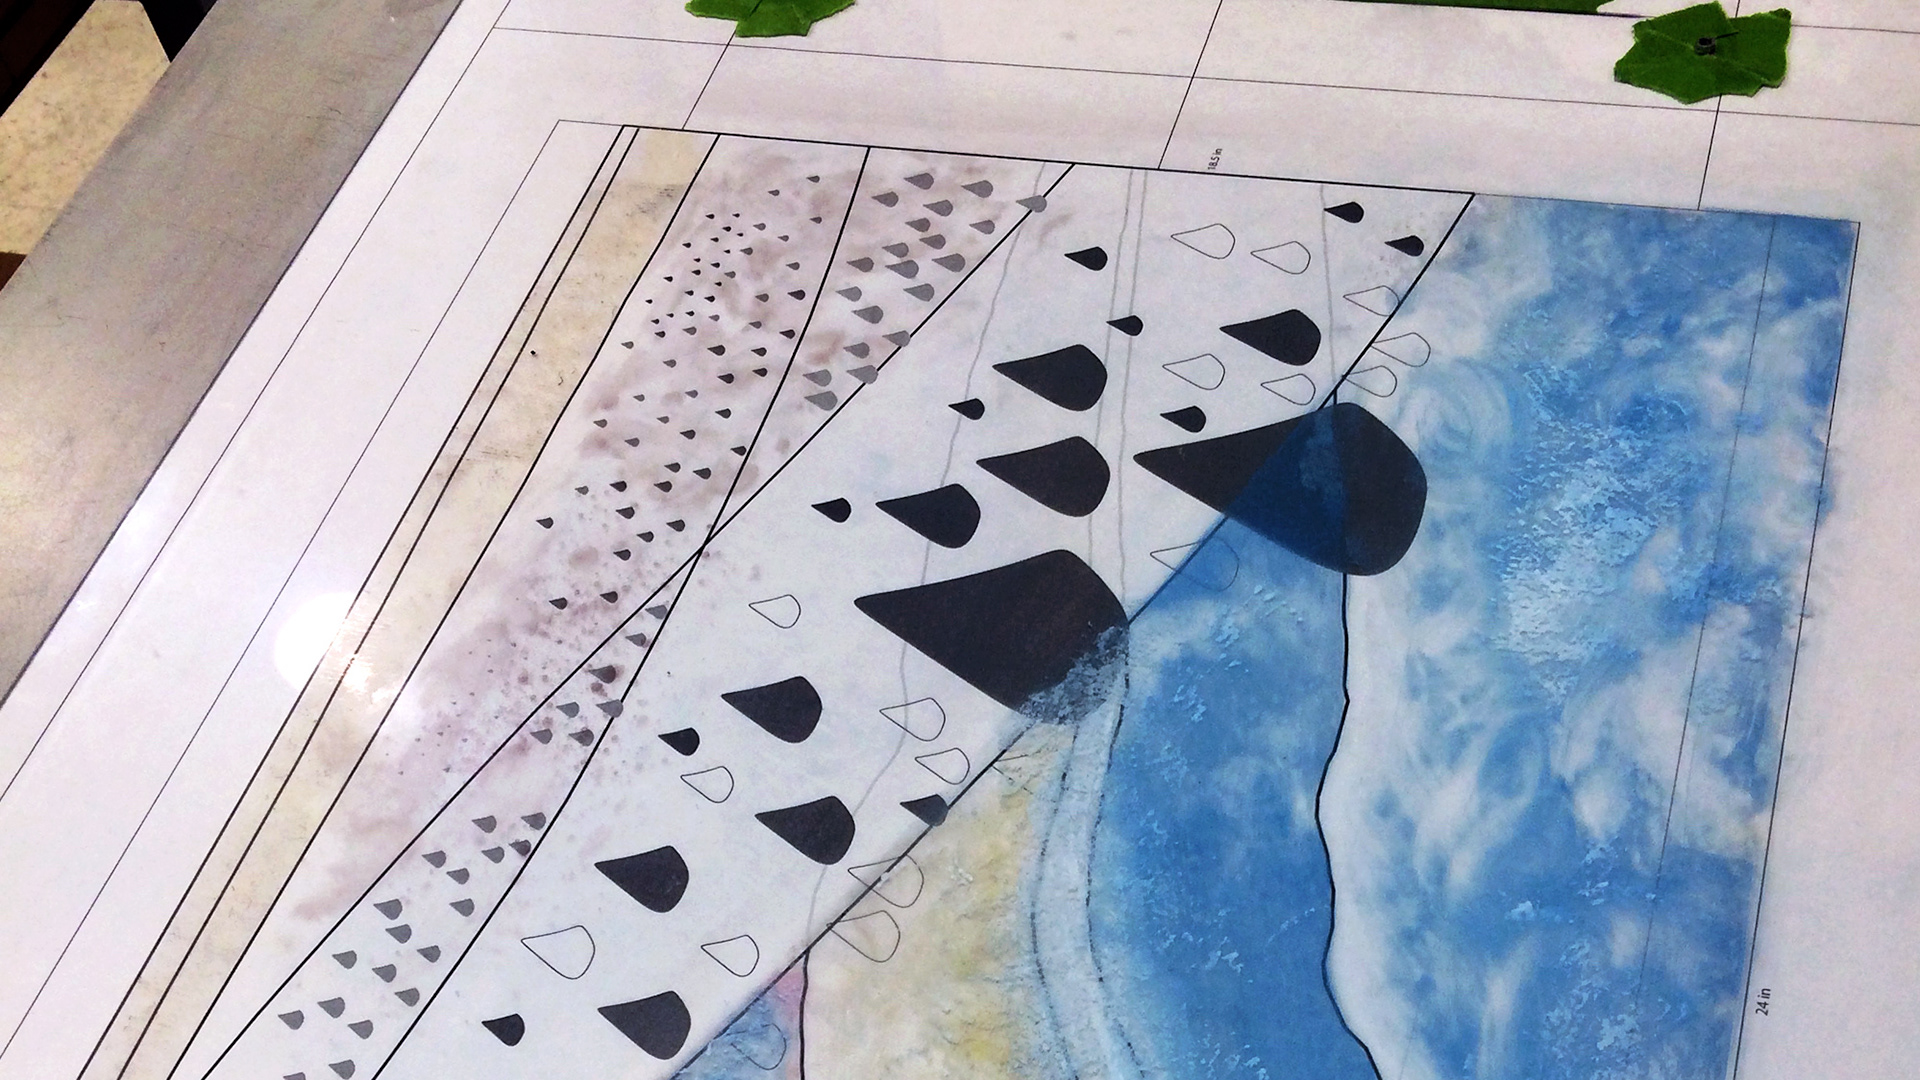
Monotyping with a plexiglass plate, my template visible underneath.