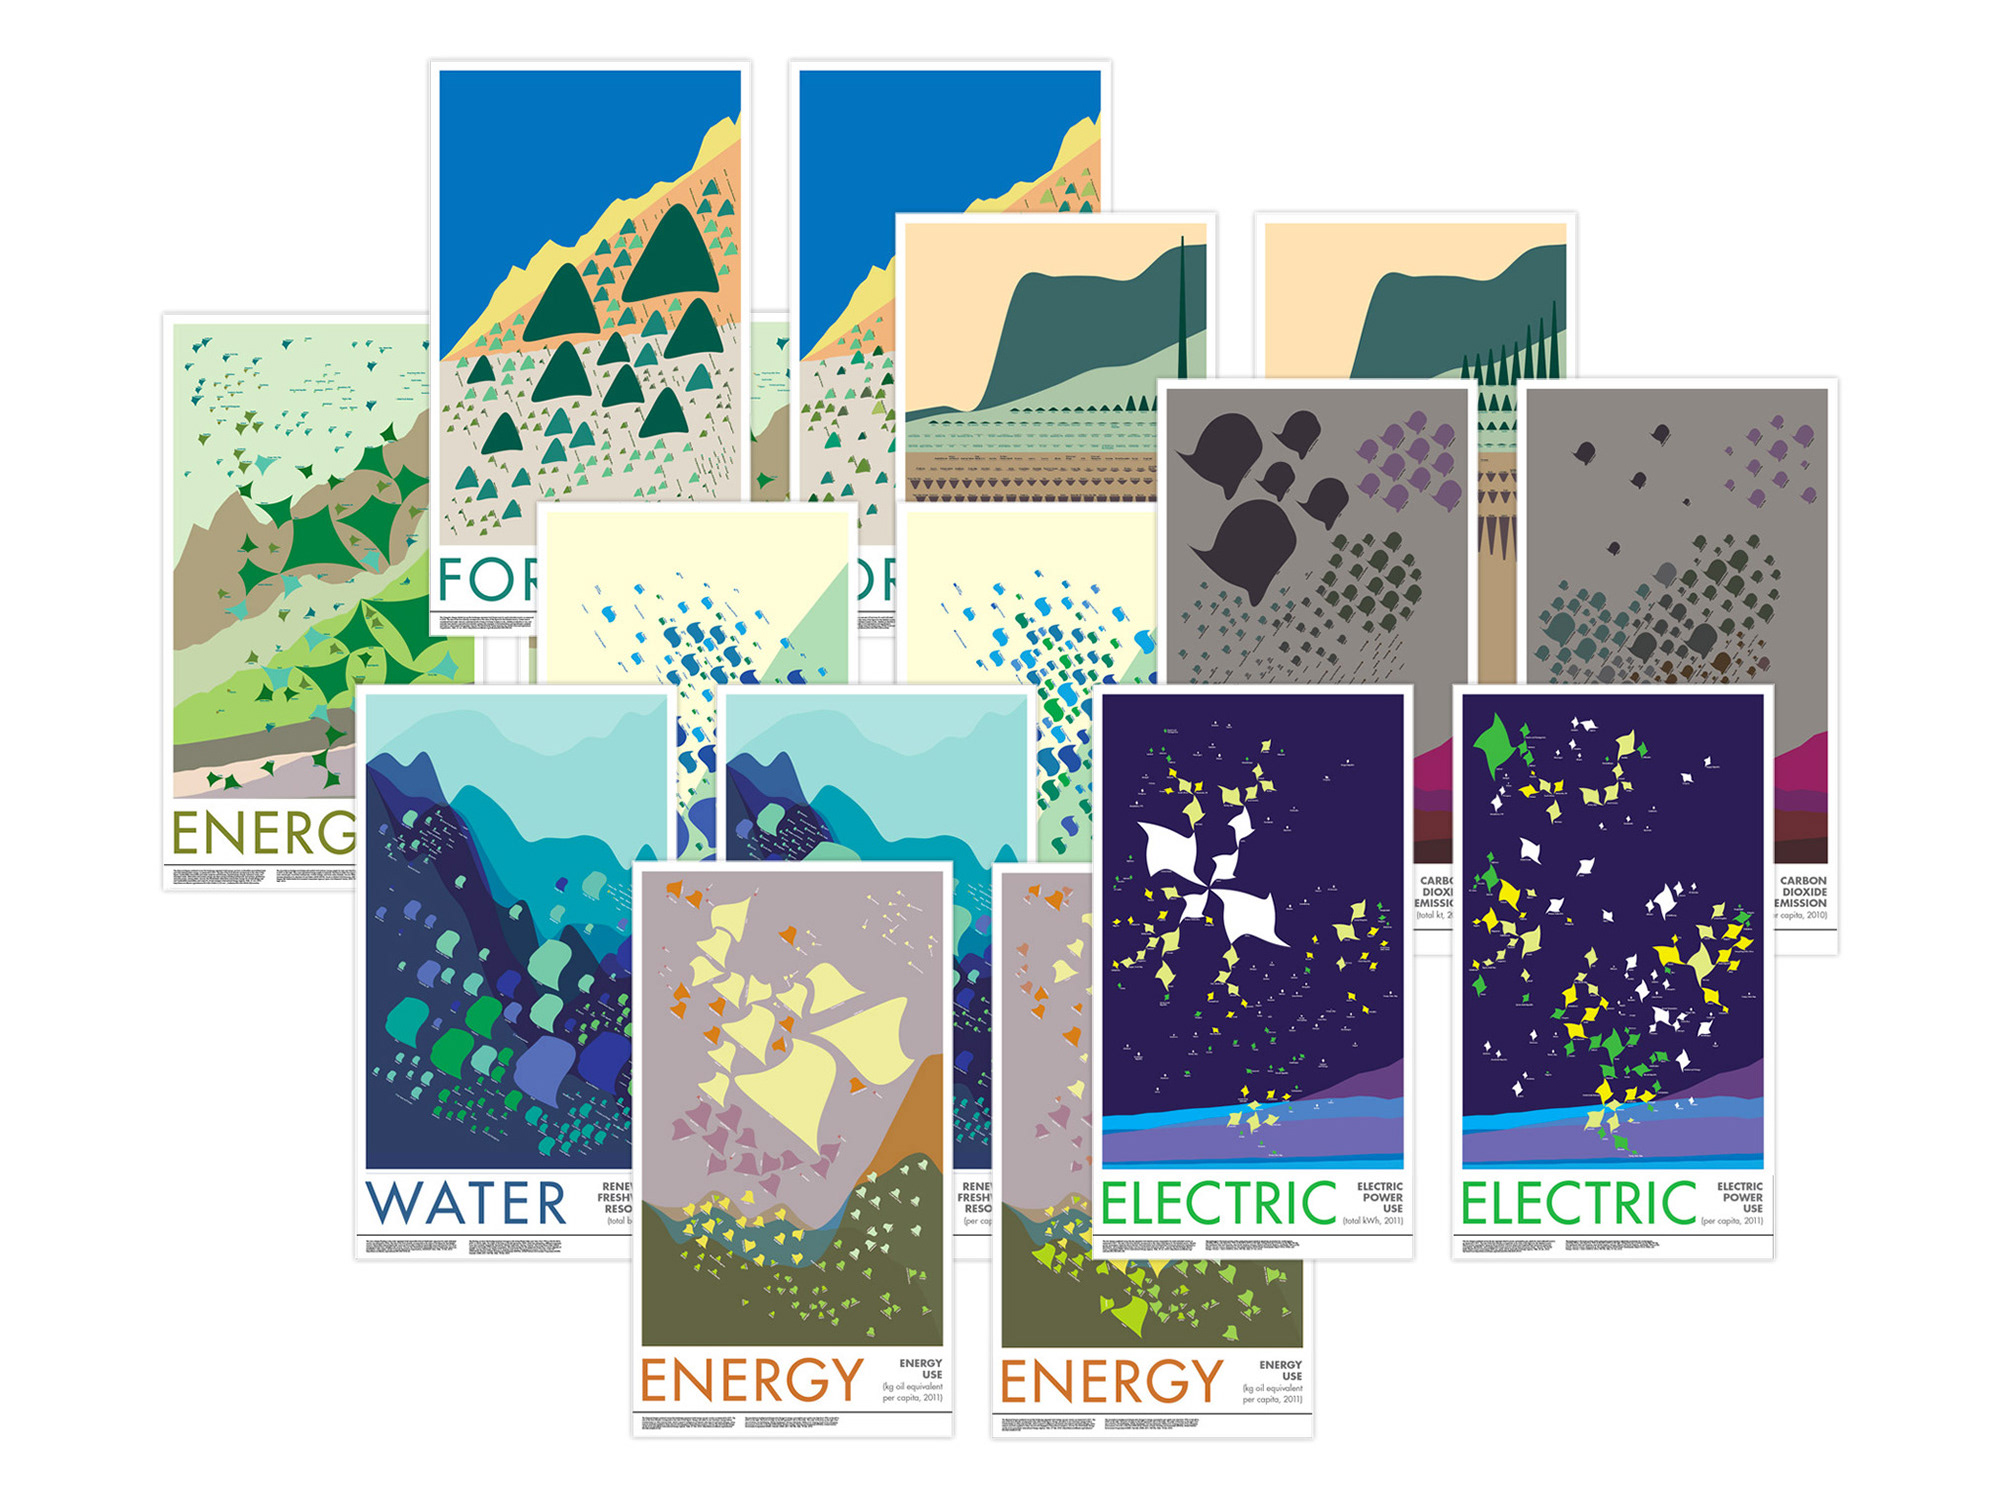
Off the Charts data viz series
Visualizing climate and energy data by country to illustrate the link between sustainability and human development.
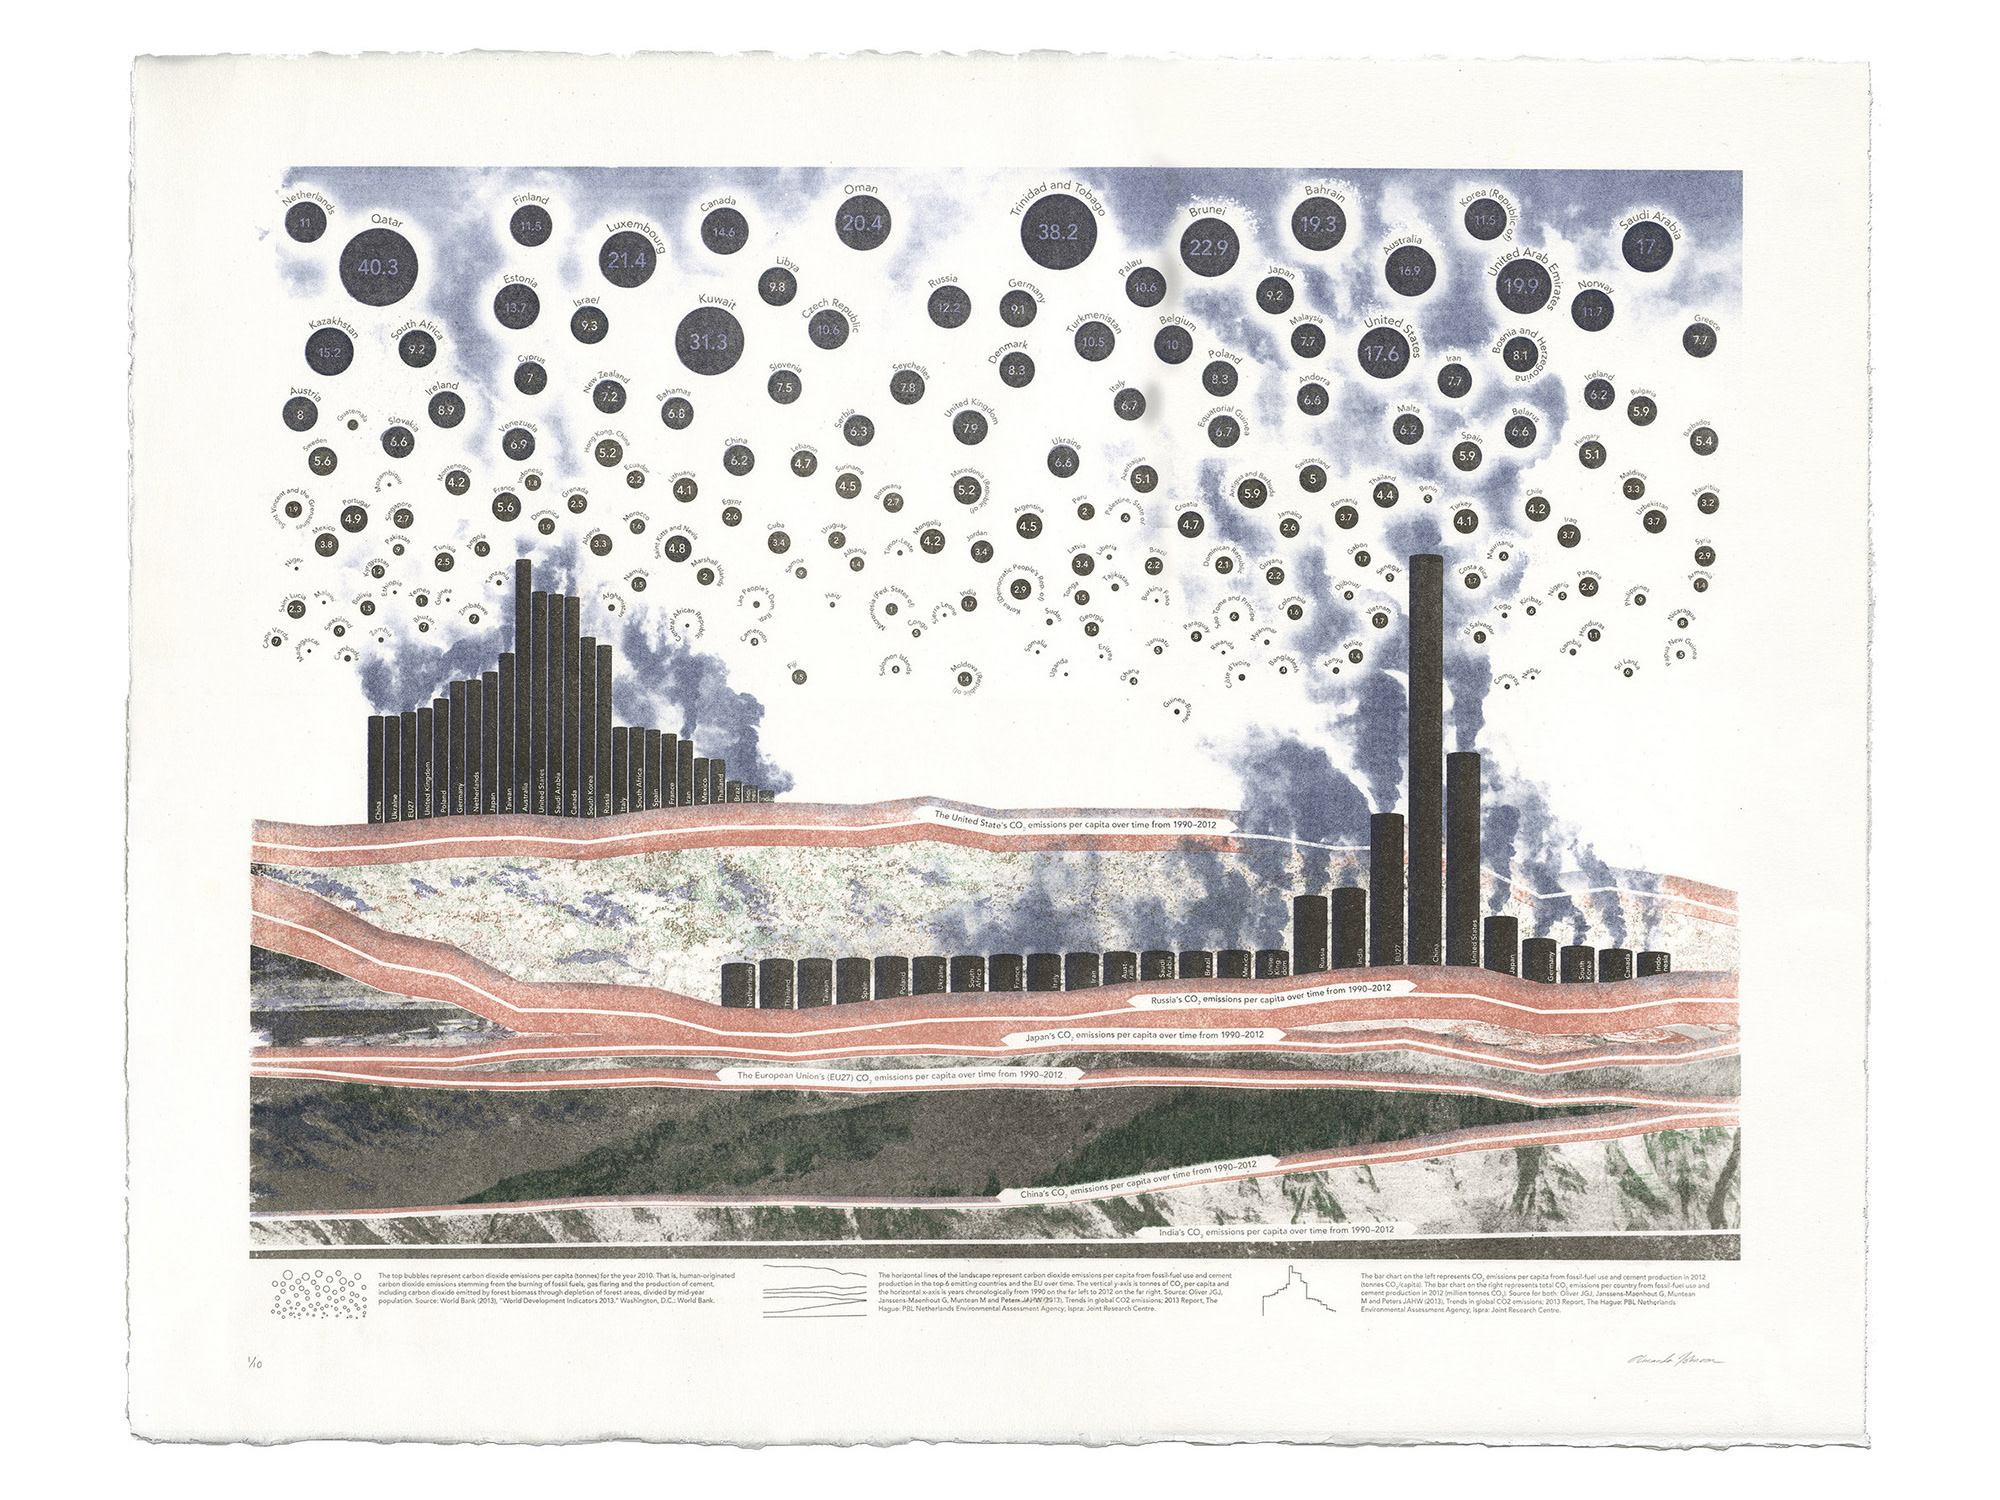
World of Indifference lithograph
A lithograph print made from four different informational charts on the theme of carbon dioxide emissions worldwide.
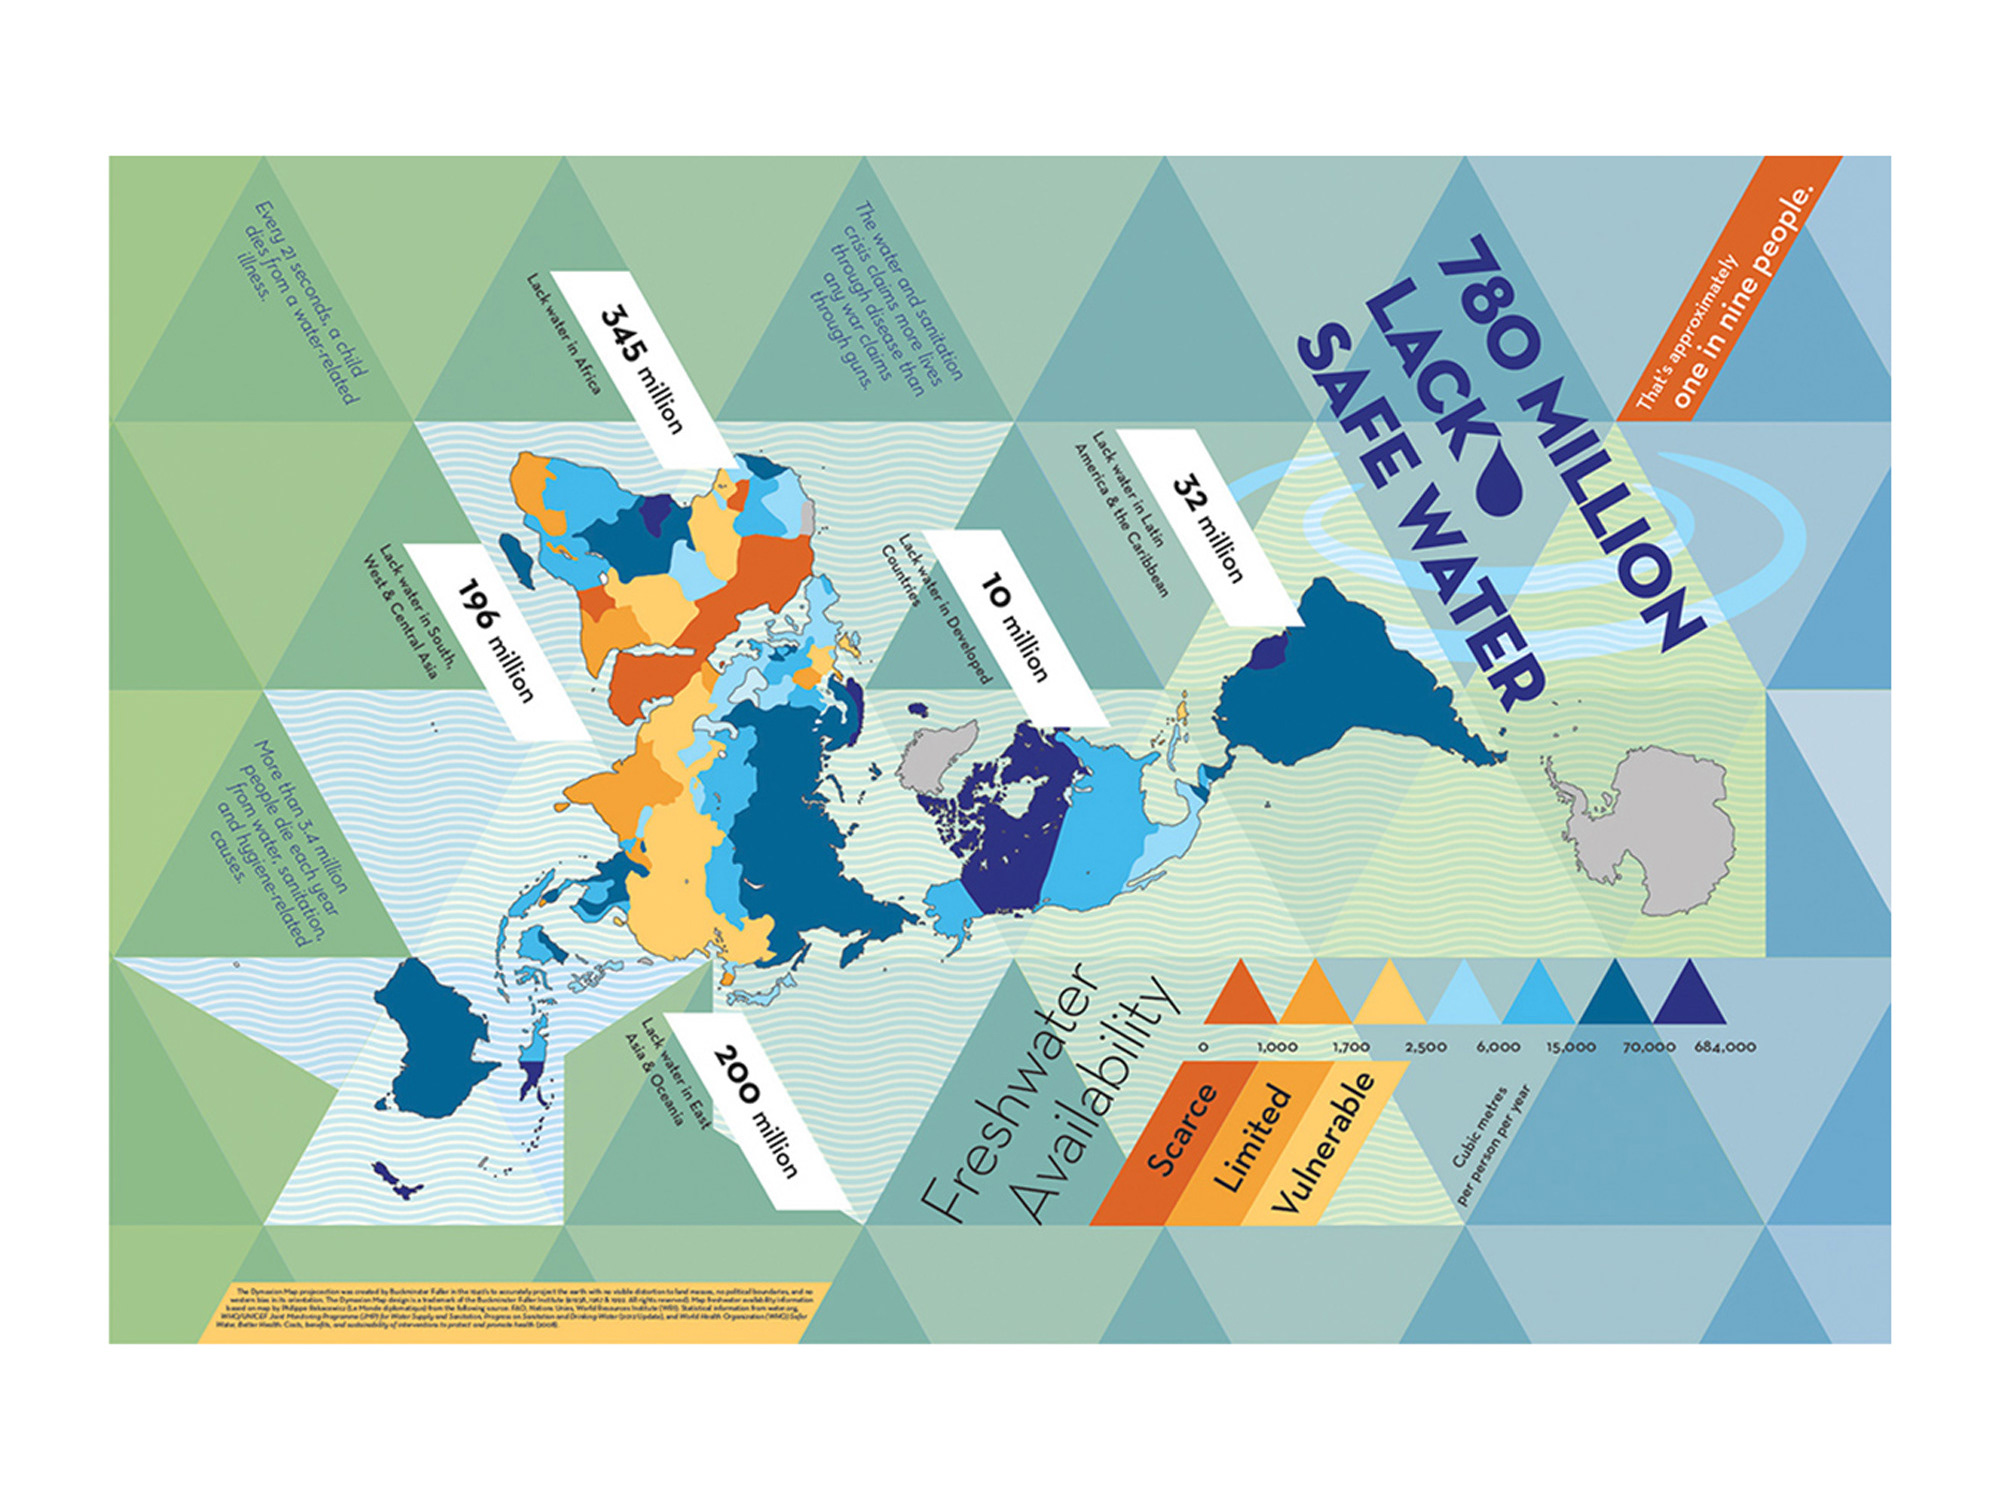
In Deep Water infographic
A poster showing safe water availability around the world. Finalist in the Buckminster Fuller Institute's Dymax Redux contest.

Beyond Measure infographics
Tree map infographic charts showing the total population of a each country that lacks access to basic necessities (clean water, sanitation, electricity).
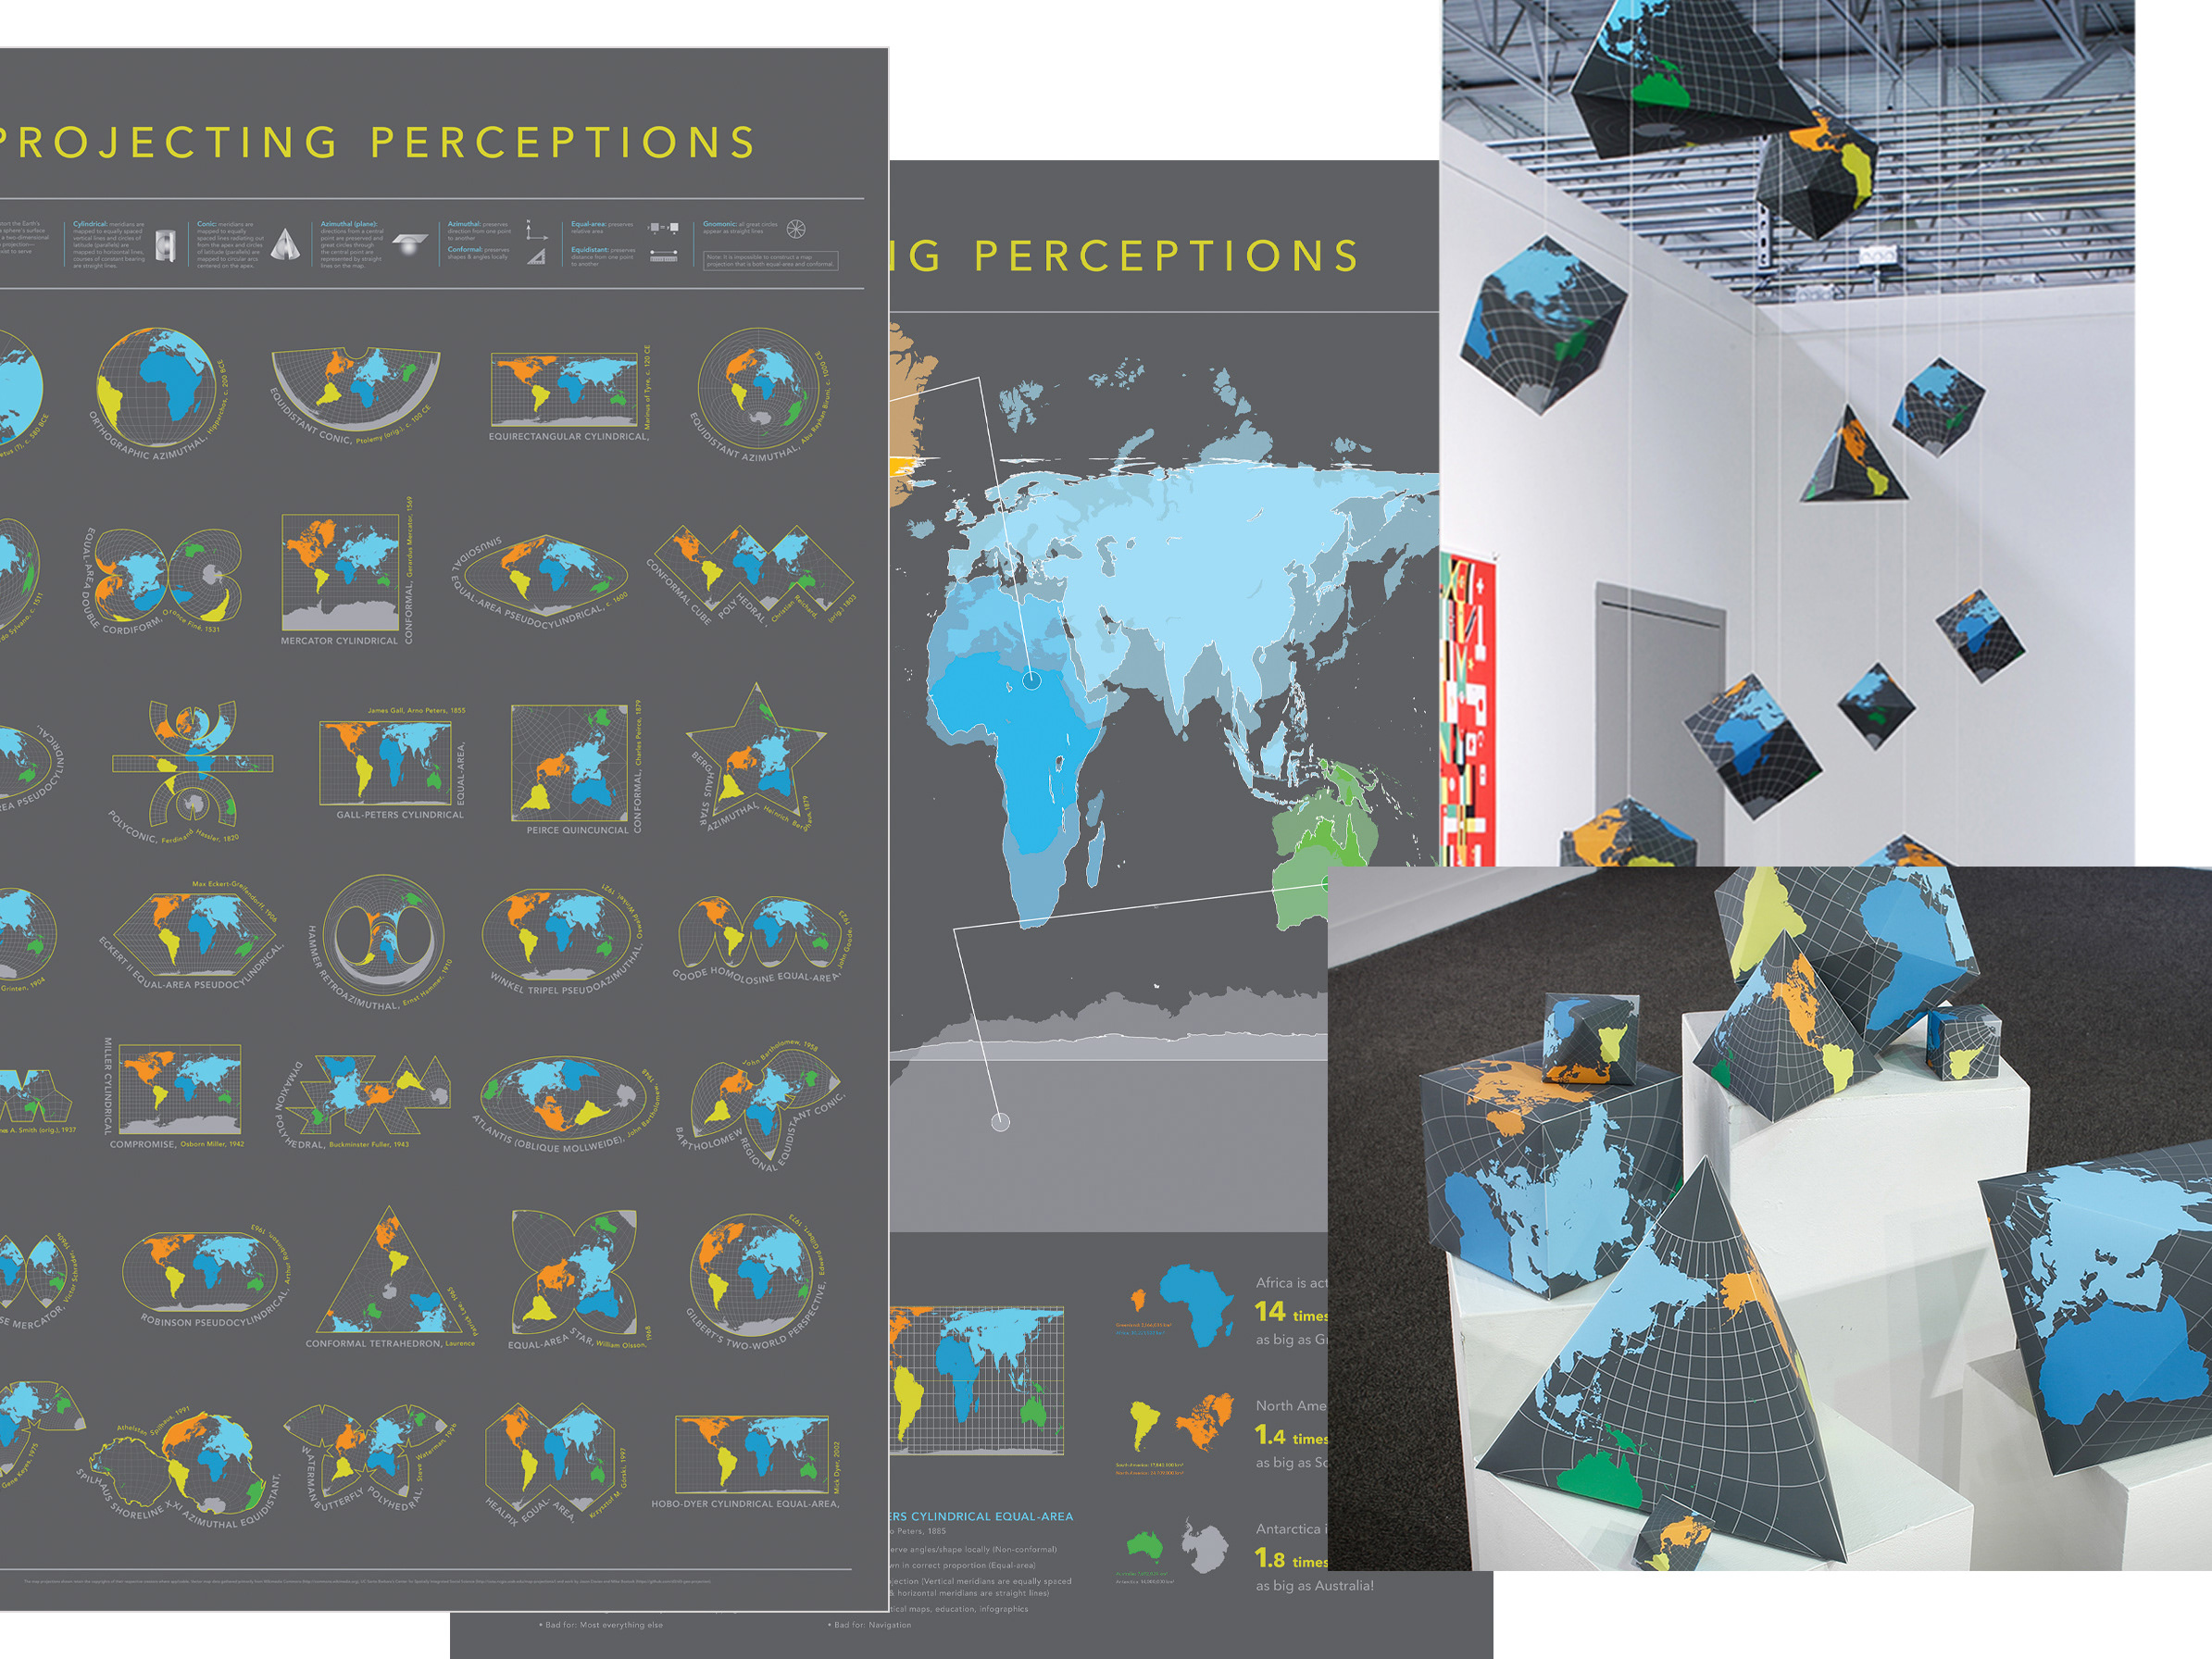
Projecting Perceptions infographics
Infographic posters and 3D polyhedrals explaining how various world map projections distort our perceptions of the world.
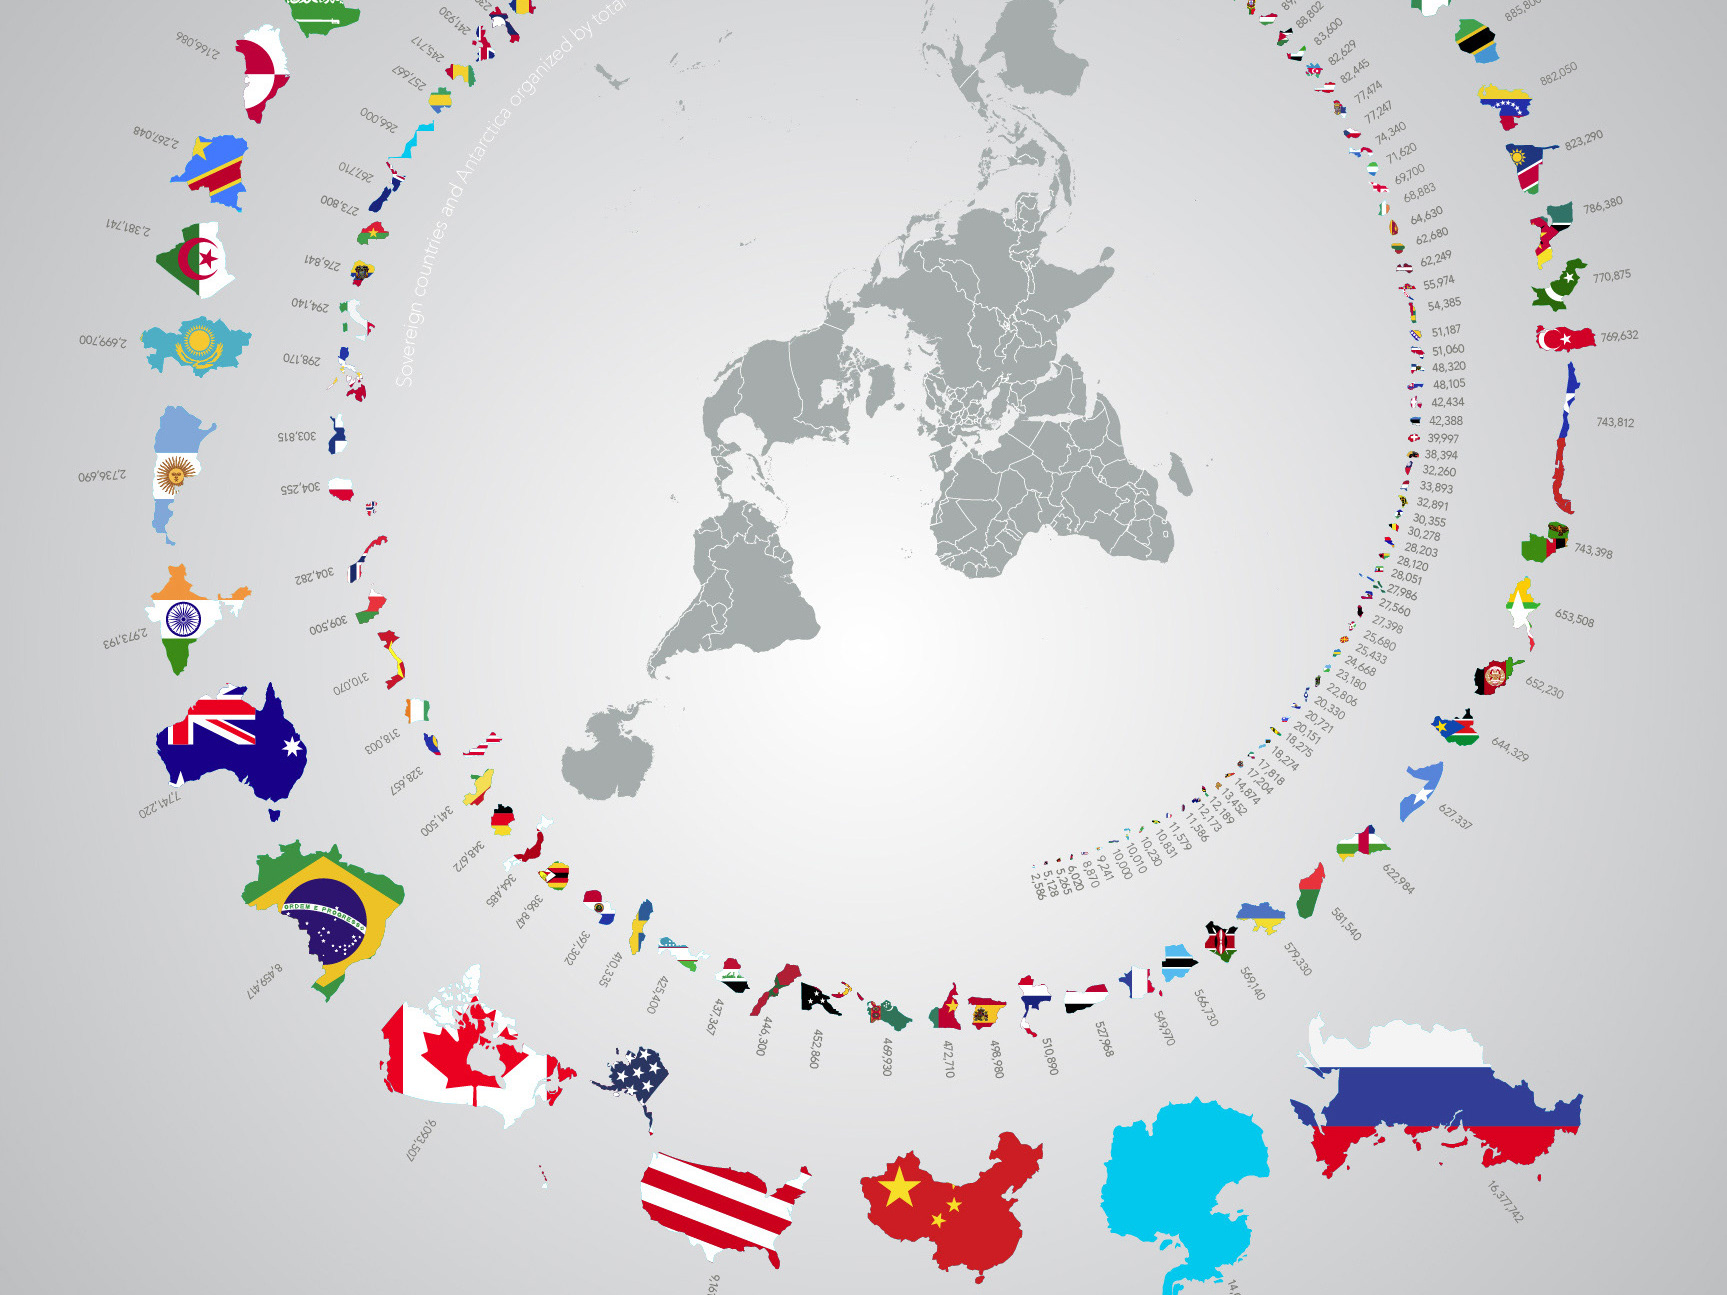
All Shapes & Sizes infographics
Infographic posters exploring political identity by showing countries organized by total land area and political flags.
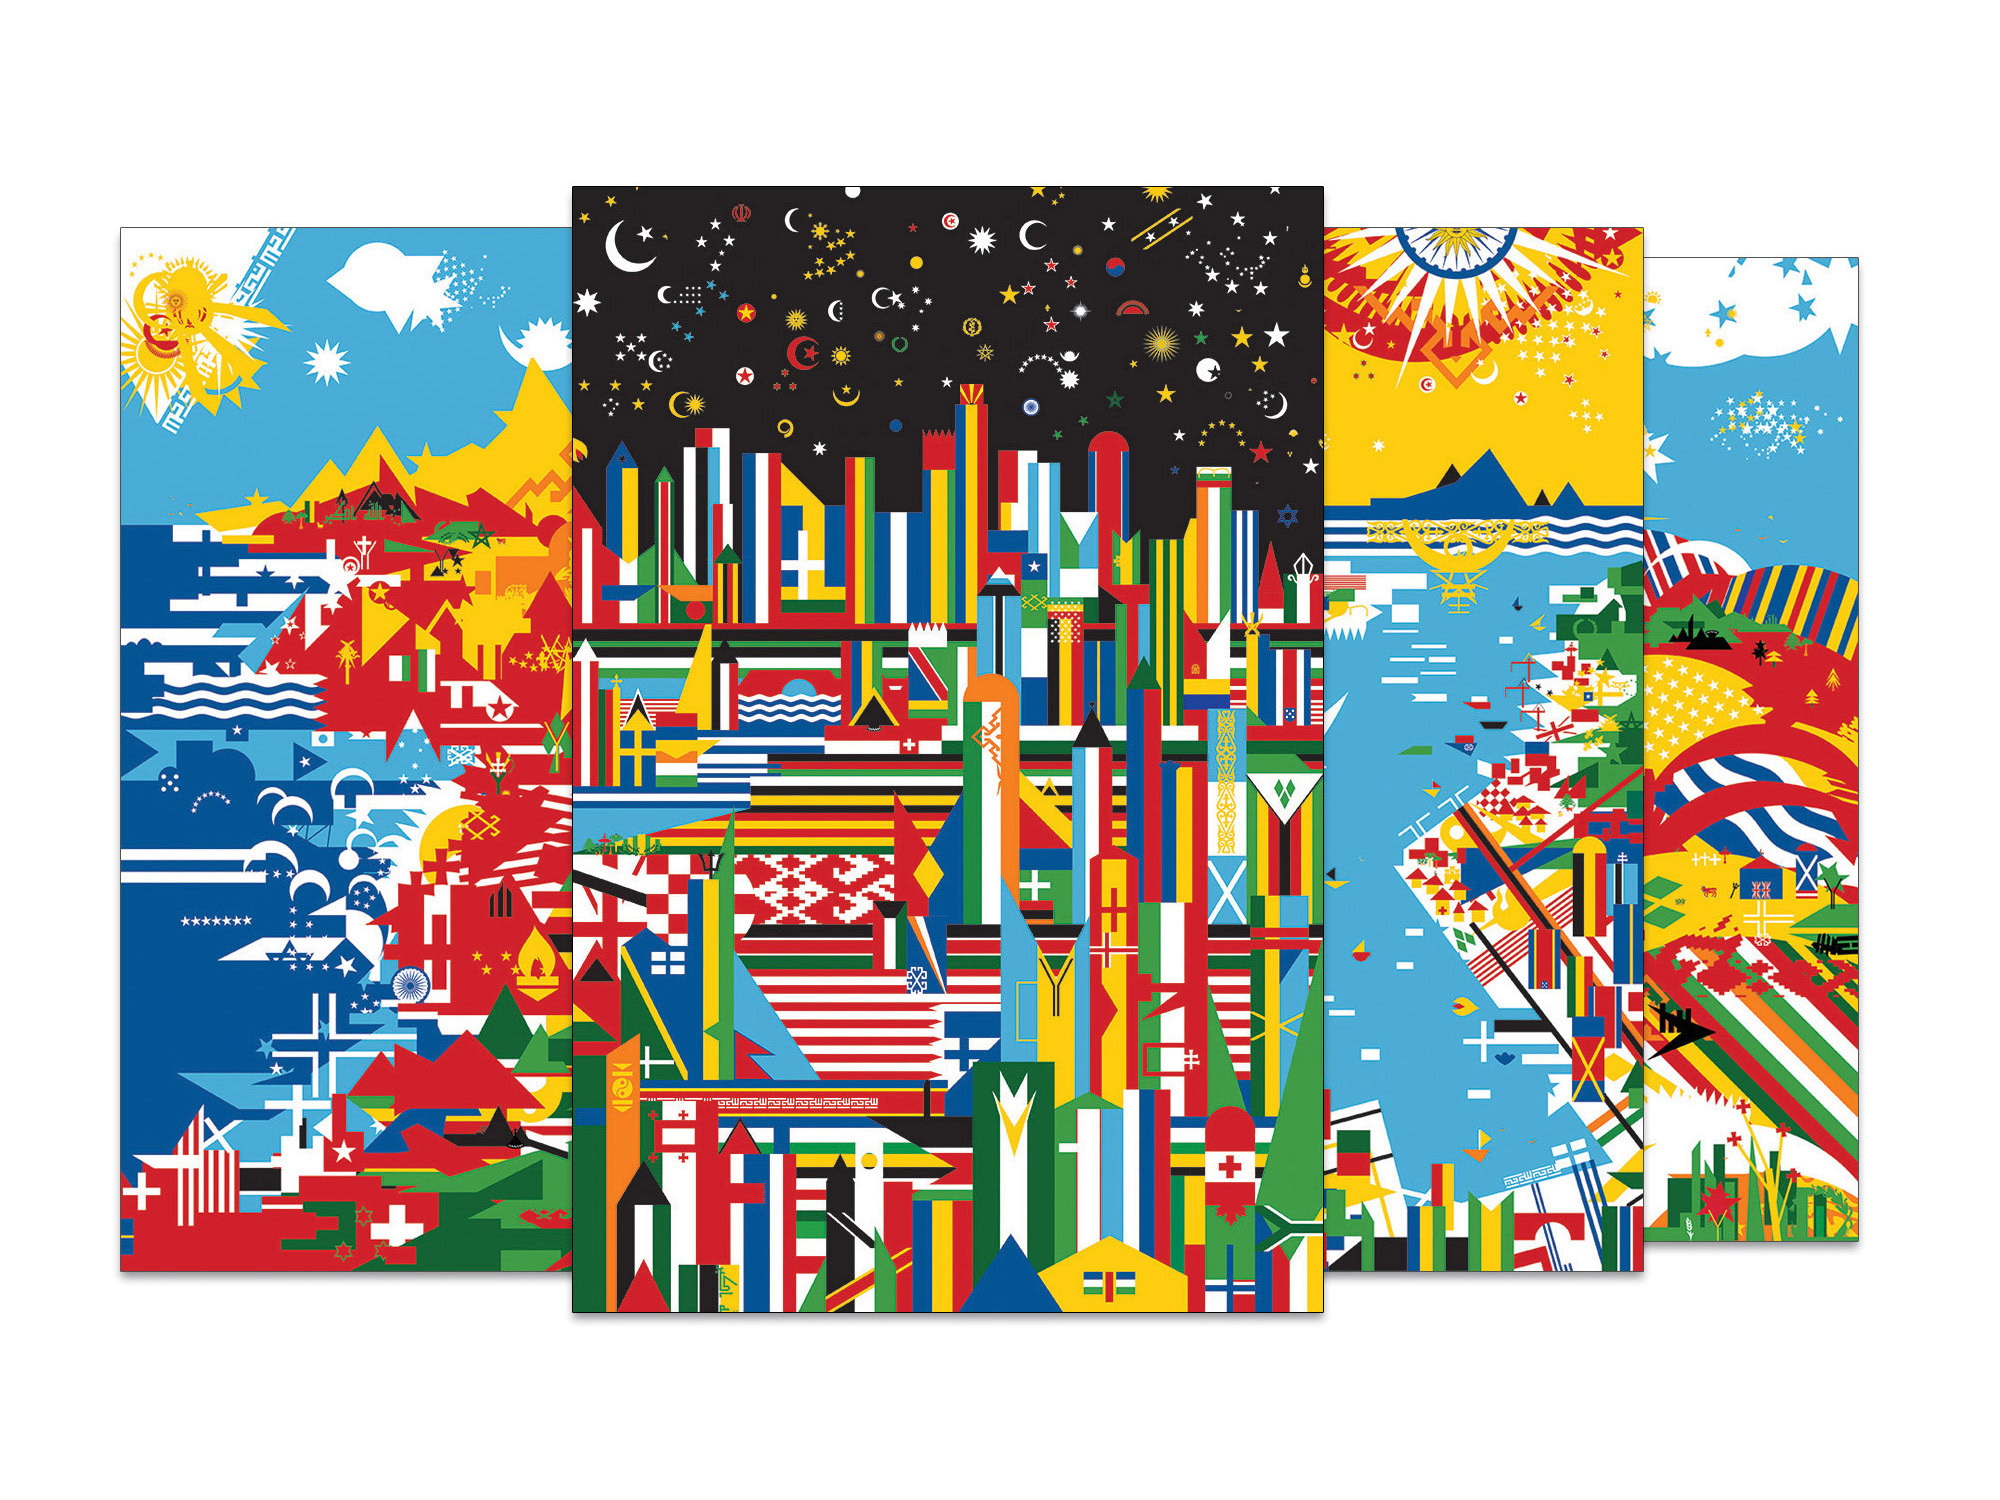
Flagscapes poster series
These illustrations were made by deconstructing country political flags into their basic geometric shapes and then rearranging the pieces to create new visions of an ideal world.
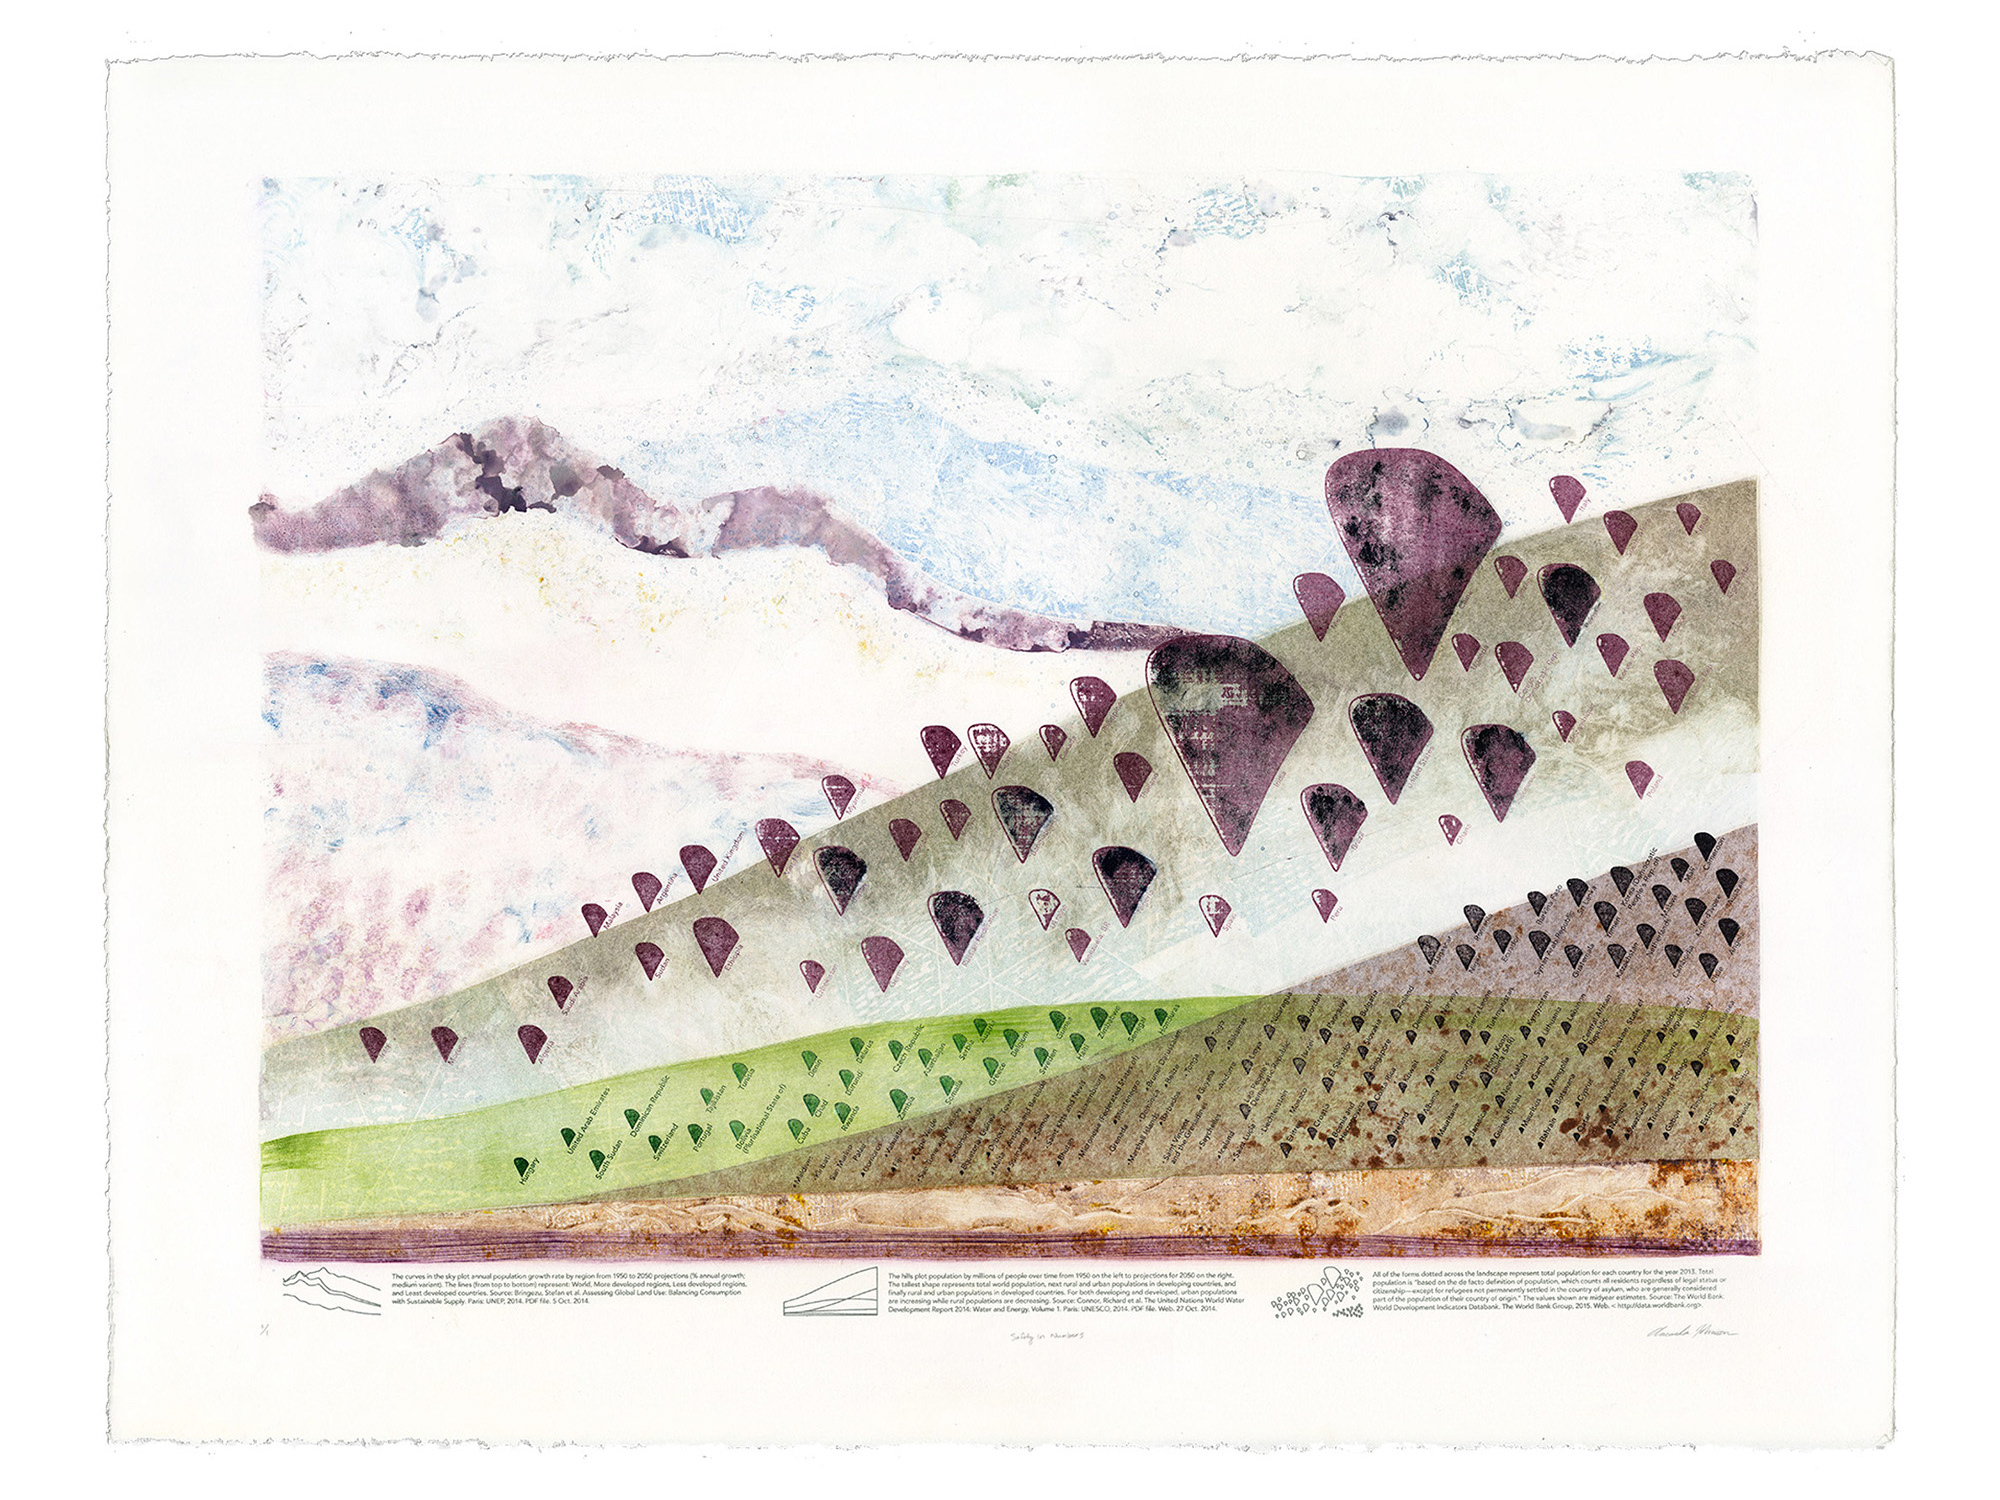
Safety in Numbers monotypes
Monotypes showing world population trends over time, annual growth rate, and total population for each country.
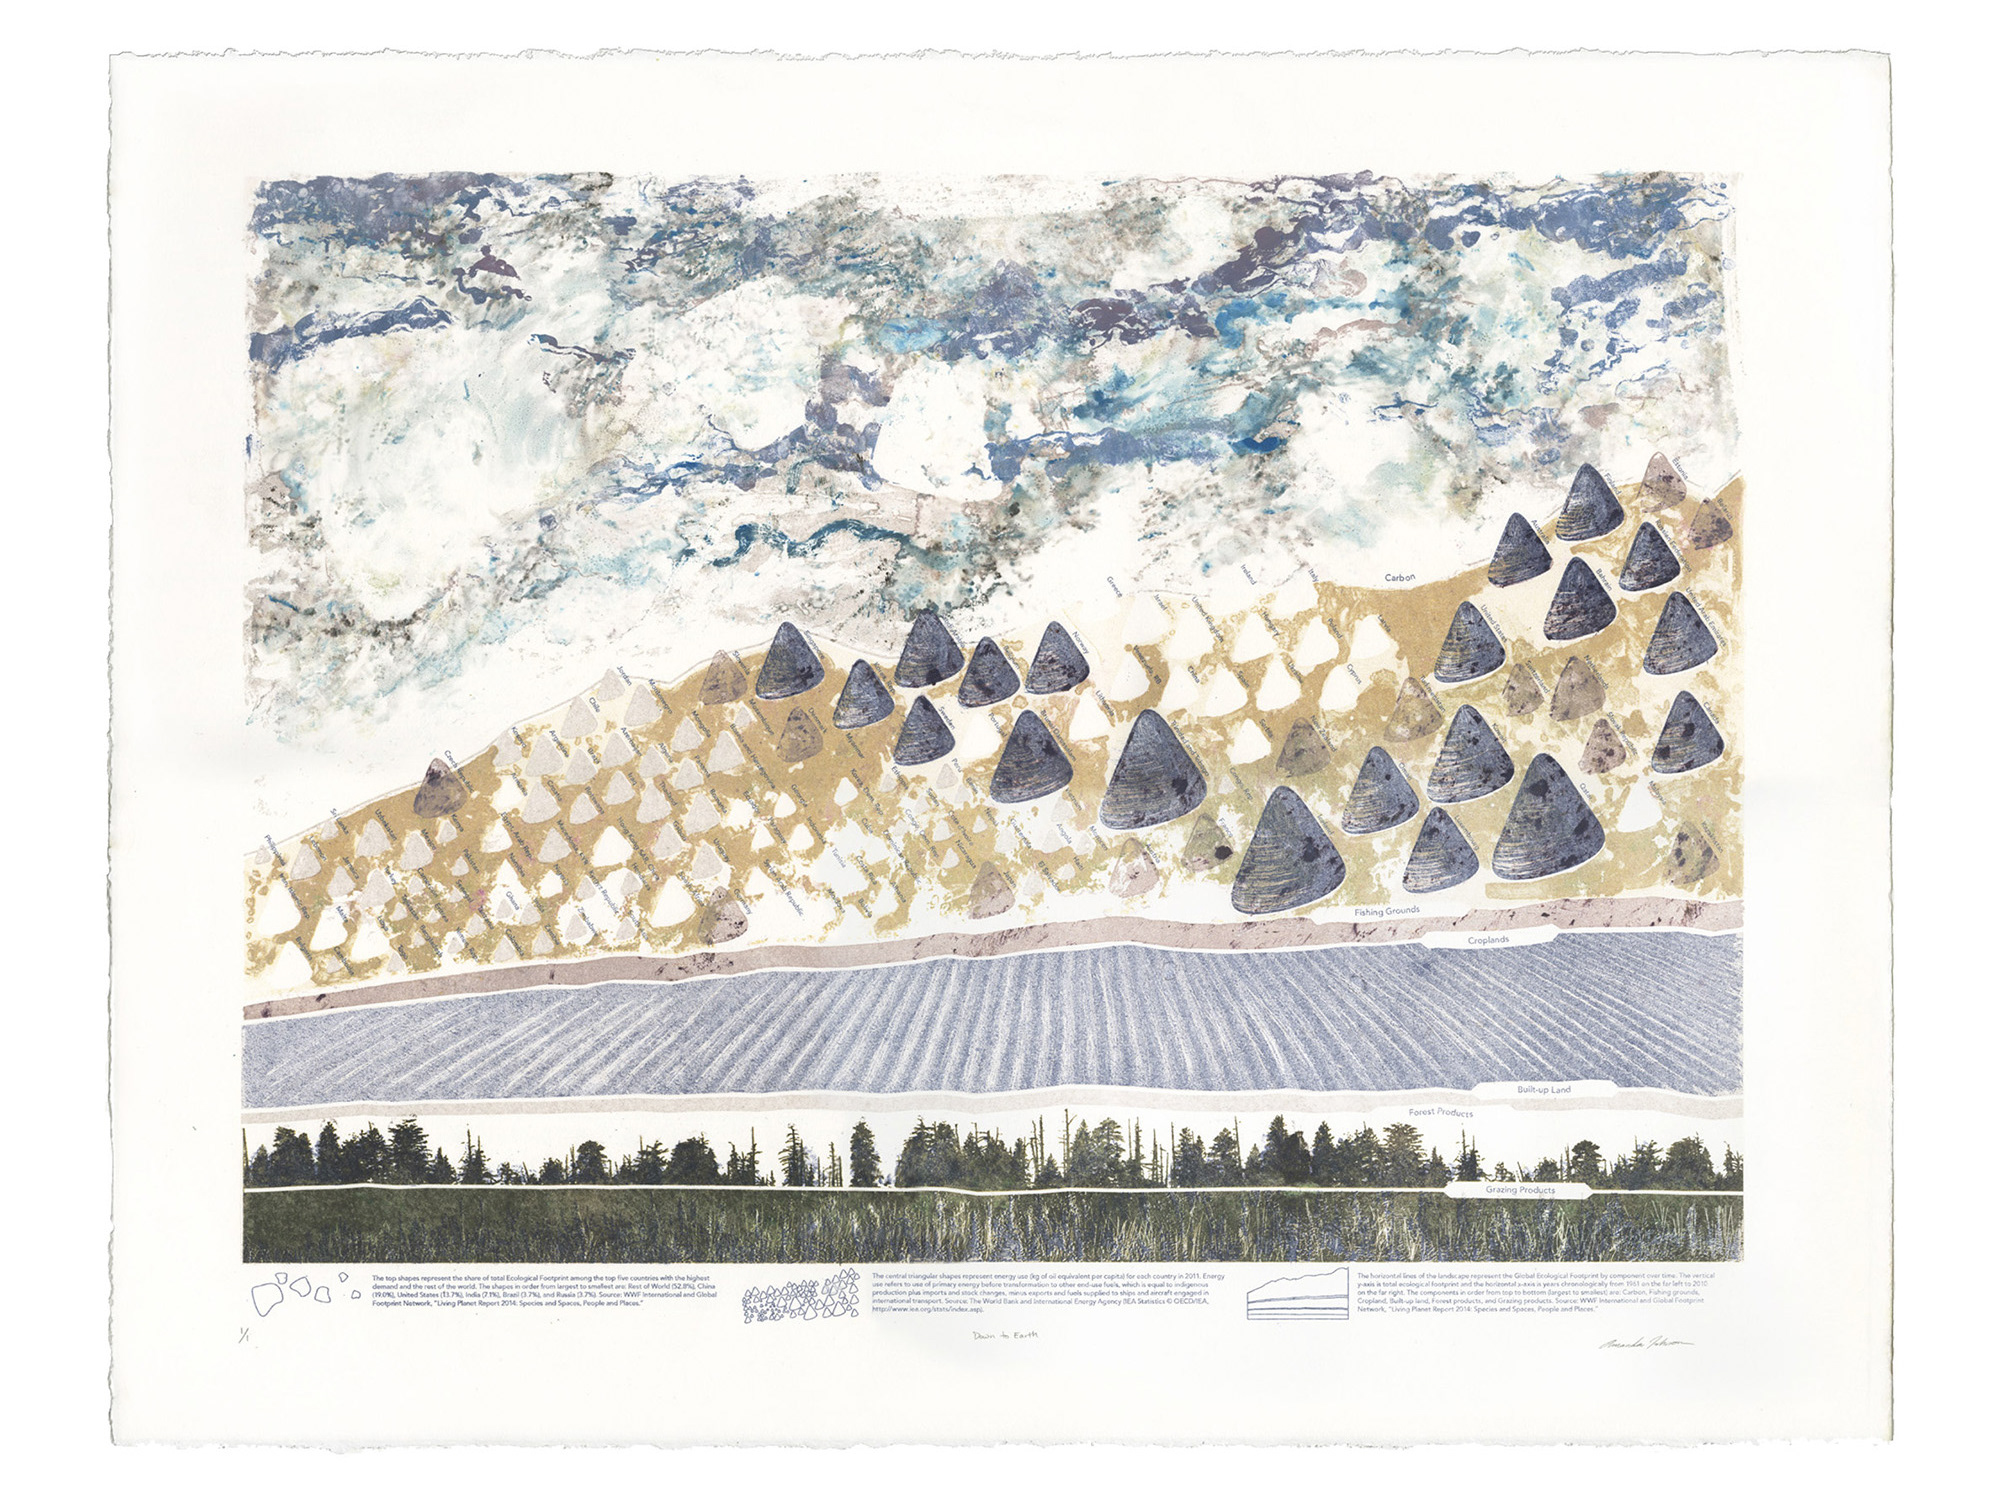
Down to Earth lithograph
Lithograph print made from three different informational charts on the theme of ecological footprints worldwide.
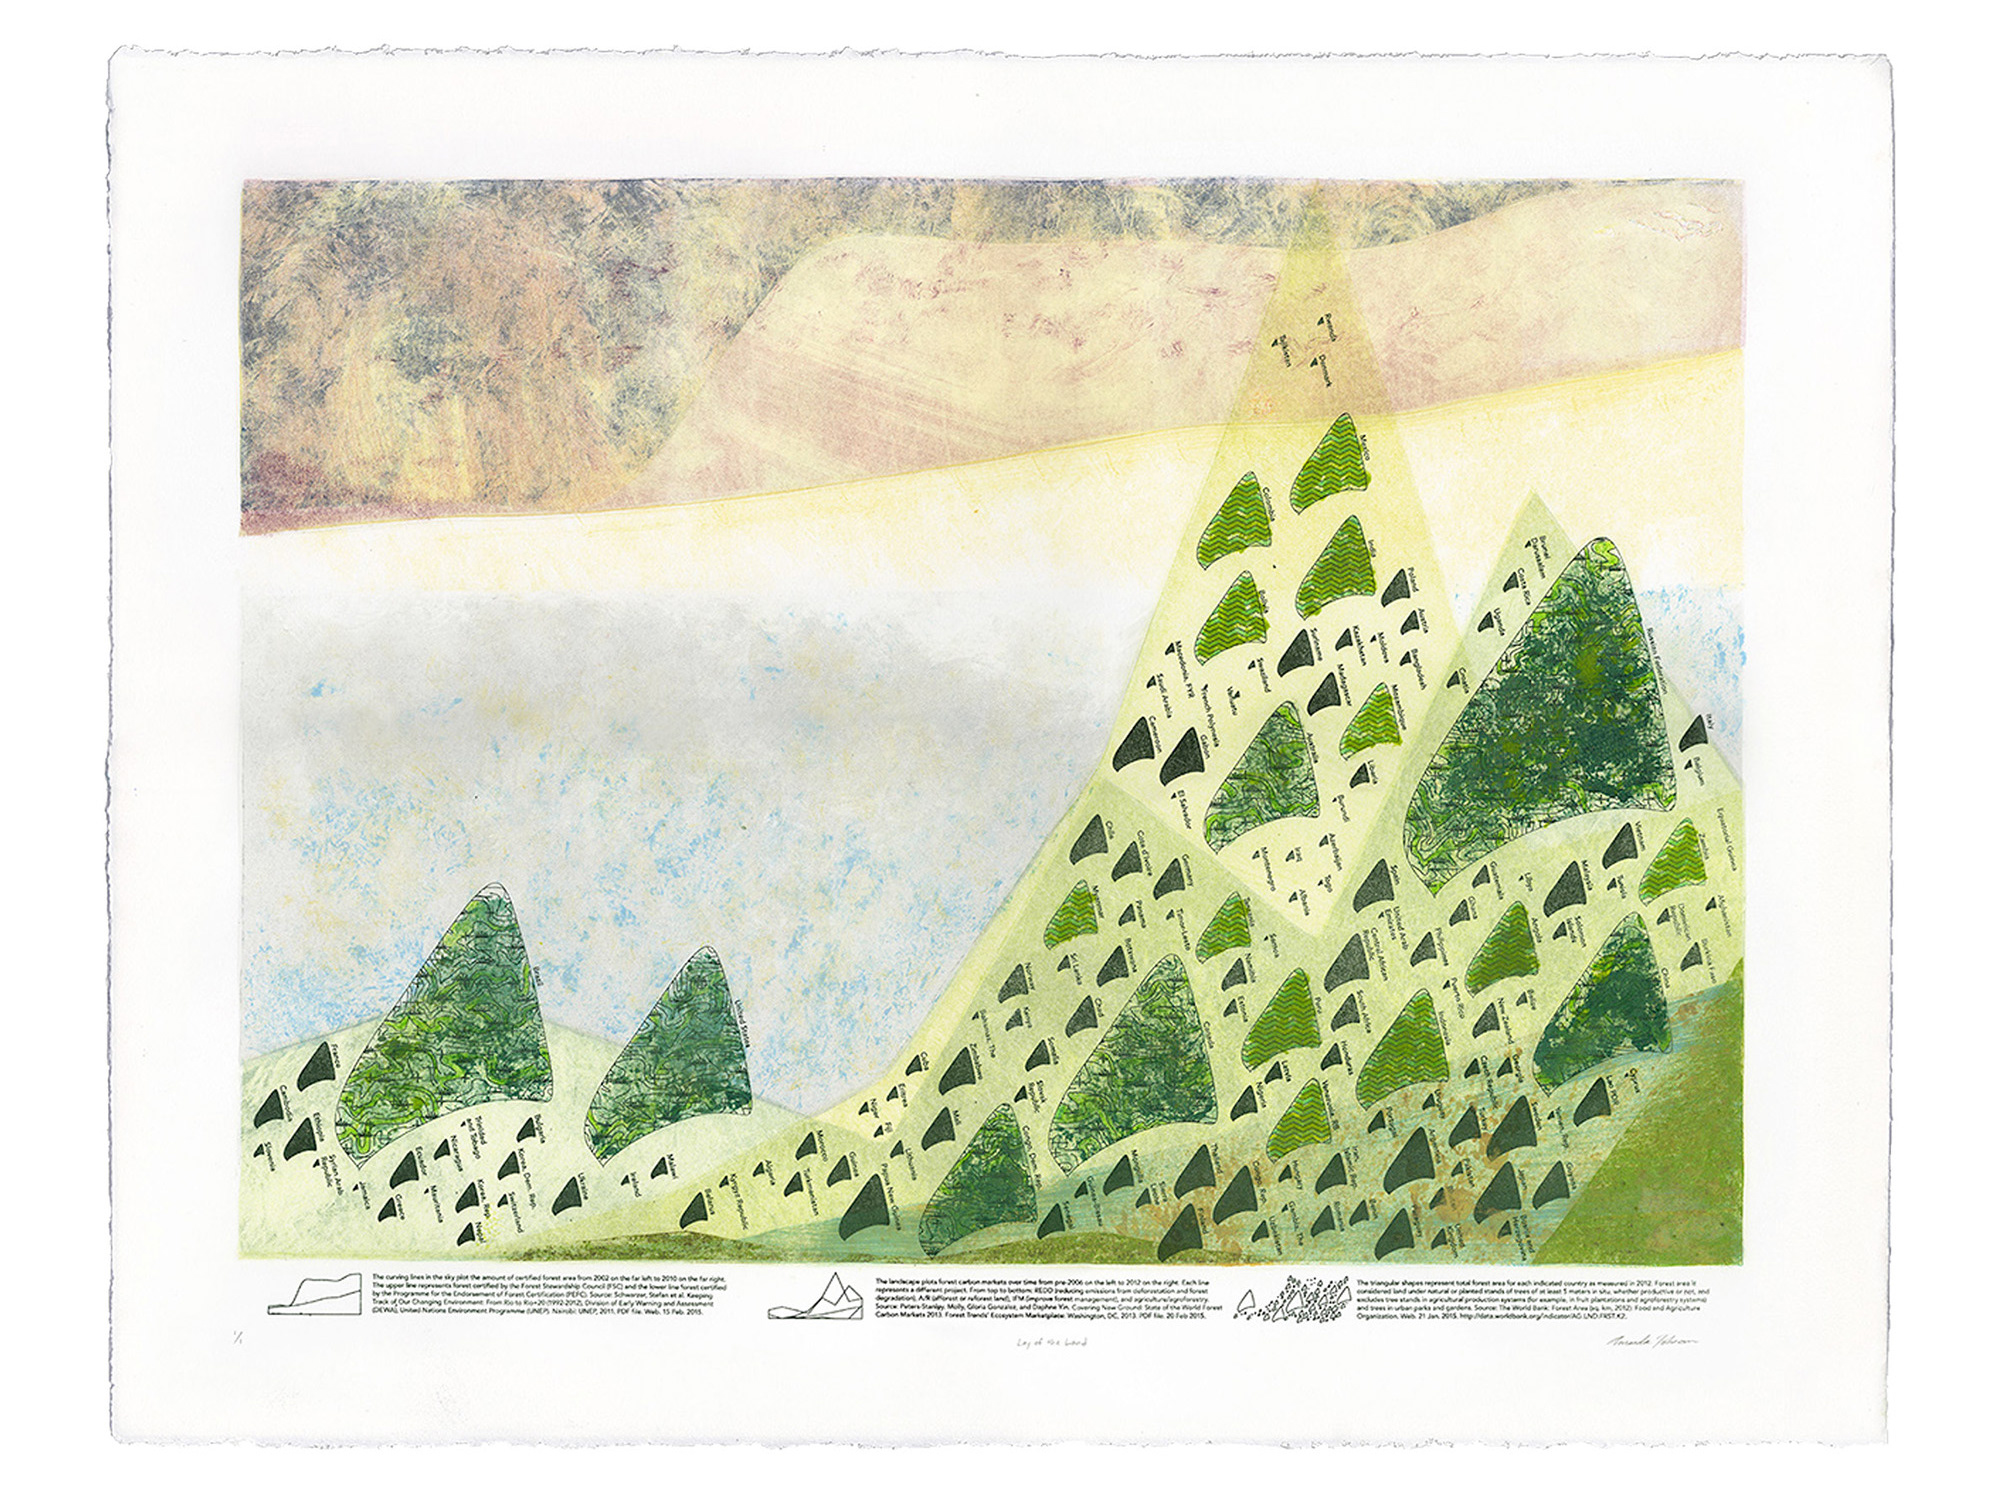
Lay of the Land monotypes
Monotypes made from data plotting forest carbon markets and total forest area for each country.

World gentleness posters
Posters advocating world peace, gentleness, and love made by rearranging the world's countries.
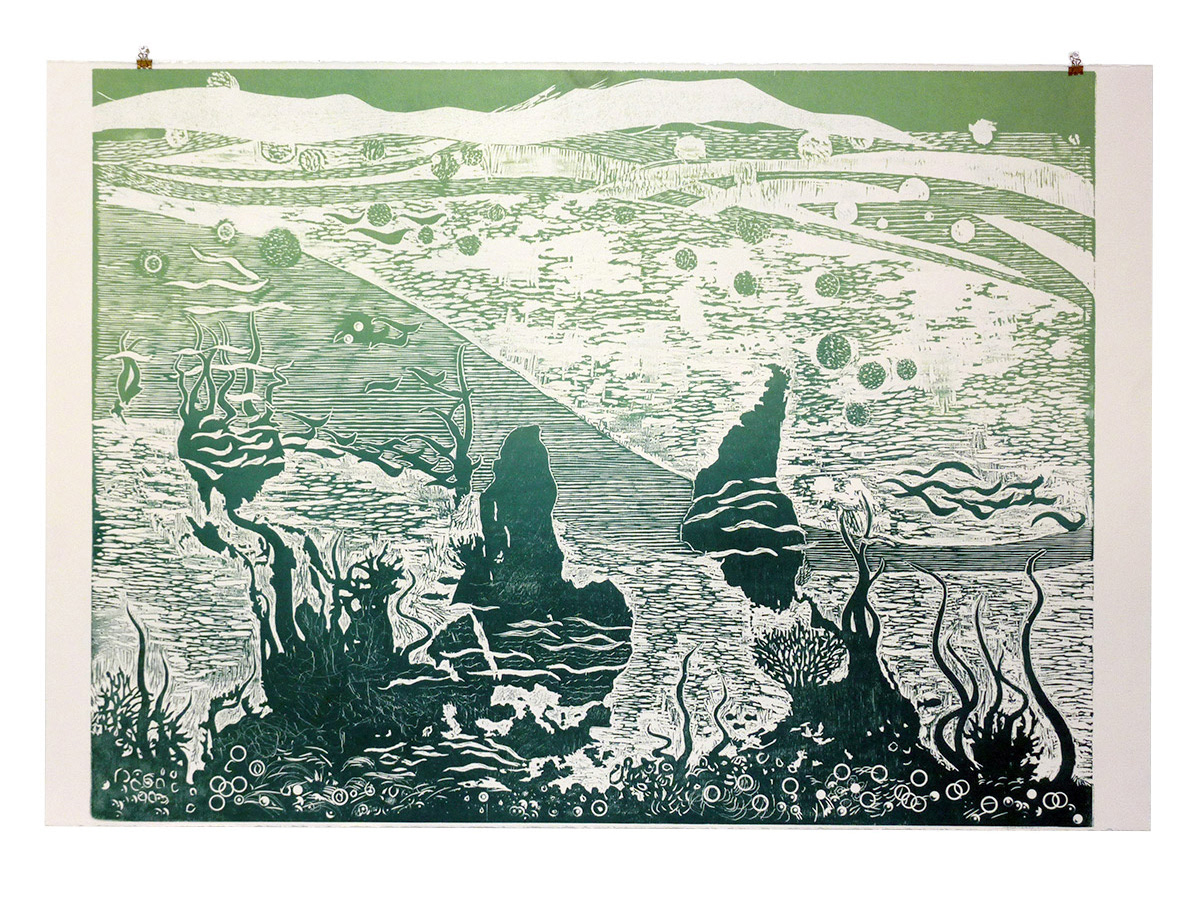
World Ecosystem woodcut
This is a 30 × 40 in woodcut relief print (variable edition of 8) printed on Stonehenge paper.